
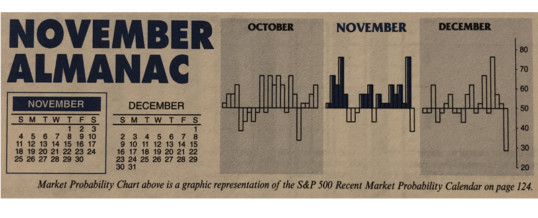
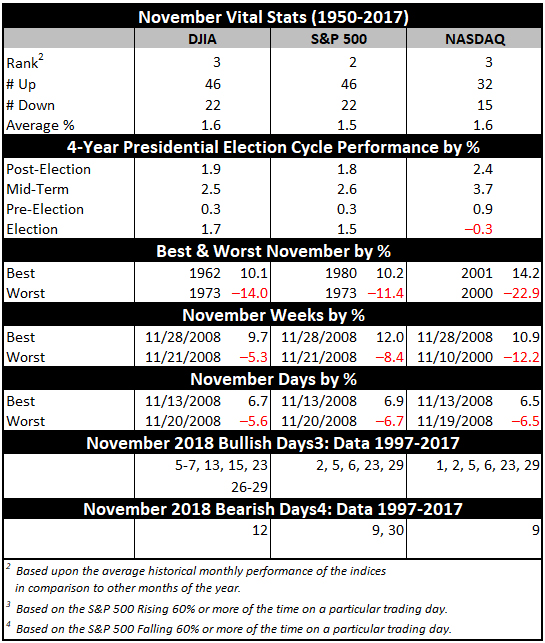
November maintains its status among the top performing months as fourth-quarter cash inflows from institutions drive November to lead the best consecutive three-month span November-January. The month has taken hits during bear markets and November 2000, down –22.9% (undecided election and a nascent bear), was NASDAQ’s second worst month on record—only October 1987 was worse.
November begins the “Best Six Months” for the DJIA and S&P 500, and the “Best Eight Months” for NASDAQ. Small caps come into favor during November, but don’t really take off until the last two weeks of the year. November is the number-three DJIA (since 1950) and NASDAQ (since 1971) month. November is second best for S&P 500.
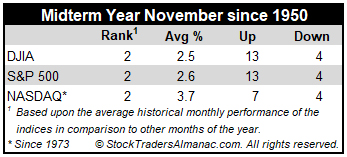
In midterm years, November’s market prowess is relatively unchanged. DJIA has advanced in 13 of the last 17 midterm years since 1950 with an average gain of 2.5%. S&P 500 has also been up in 13 of the past 17 midterm years, gaining on average 2.6%. The only real blemish in the November midterm-year record is 1974 (DJIA –7.0%, bear market ended in December).
OCT
2018