Posts Tagged 'GDP'

May 2019 Market at a Glance

Seasonal:

Neutral. May officially marks the beginning of the “Worst Six Months” for the DJIA and S&P. To wit: “Sell in May and go away.” But NASDAQ’s “Best Eight Months” last until June. In pre-election years, May can be challenging ranking #10 for DJIA and S&P 500 with fractional average gains. NASDAQ has been stronger, ranking #7 with an average advance ...

Continue Reading →
0

Almanac Update March 2019: Even Better in Pre-Election Years

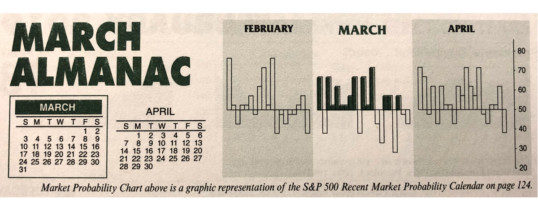
Turbulent March markets tend to drive prices up early in the month and batter stocks at month end. Julius Caesar failed to heed the famous warning to “beware the Ides of March” but investors have been served well when they have. Stock prices have a propensity to decline, sometimes rather precipitously, during the latter days of the month. In March 2001, DJIA plunged 1469 points (-13.5%) from March 9 to the 22.

March packs a rather busy docket. It is the ...

Continue Reading →
0

February 2019 Market at a Glance

Seasonal:

Bullish. February’s long-term track record is mixed. In all years February ranks no better than seventh. However, in pre-election years, February’s performance generally improves with average returns all turning positive. NASDAQ performs best, gaining an average 2.8% in pre-election-year Februarys since 1971. Russell 2000 is second best, averaging gains of 2.5% since 1979. DJIA and S&P 500, the large-cap indices, ...

Continue Reading →
0

January 2019 Market at a Glance

Seasonal:

Bullish. January is the third month of the Best Six/Eight, but it is the last of the Best-Three-Consecutive-month span. January is the top month for NASDAQ (since 1971) averaging 2.6%, but it has slipped to sixth for DJIA and S&P 500 since 1950. Pre-election-year Januarys have been exceptional (DJIA +3.7%, S&P 500 +3.9% NASDAQ +6.6%). The Santa Claus Rally ends ...

Continue Reading →
0
Page 5 of 7 «...34567