

November has historically begun the Best Six Months for the Dow and S&P 500 and NASDAQ’s Best Eight Months. It has also marked the start of the year’s Best Three-Month Span November-January. Seasonal October volatility was exacerbated by Presidential election uncertainty and the rapid rise of covid-19 cases worldwide. But we believe this is setting up very well for our Seasonal MACD Buy Signal.
Seasonality’s Quarantine Is Over
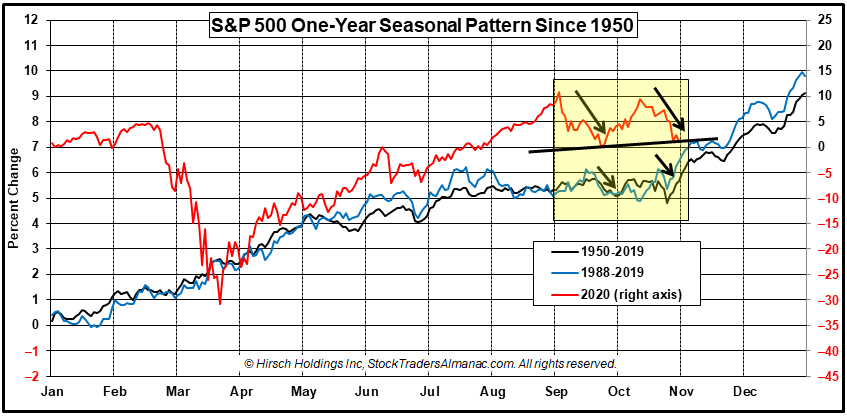
October’s market weakness and volatility is actually an encouraging sign for us. While it may be painful to some investors and unnerving at times, to us it signifies a return to more normal seasonal market behavior, which has set up the Best Months for solid gains in the past. Updating the chart we presented last month of S&P 500 for 2020 (right axis) overlaid on the One-Year Seasonal Pattern since 1950 and 1988 (left axis) underscores the return of market seasonality.
September and October weakness this year closely mirrors the historical pattern over the past 70-year and 32-year timeframes. S&P also appears to have made a classic late-October low. This October low did not breach the September low so far and if the low on October 30 holds it forms a slightly higher-low uptrend line of support.
As for handicapping the election, our colleague Sam Stovall’s August-October Market “Presidential Predictor” closed in the red. When the S&P is lower from July 31 to October 31 in election years it is not a great sign for an incumbent presidential party win.
However, as long as we have an expeditious decision on the winner, the market has generally rallied November-December no matter the winner. When incumbent parties win S&P 500 is up only 0.07% on average in November and 1.7% in December. When they lose S&P 500 is up 1.5% in November and 1.1% in December.
Since 1936 when the S&P 500 is up from the July 31 close to the October 31 close in election years the incumbent party wins 85% of the time (11 of 13). When the S&P is down over this three-month span the party in control of the White House has changed 88% of the time (7 of 8).
Two misses were likely due to significant third-party candidates derailing reelections in 1968 (Wallace) and 1980 (Anderson). Eisenhower was reelected in 1956 despite the bear market caused by the Suez Crisis/Sinai War in October-November 1956 and Soviet tanks rolling into Hungary to quell the revolution in October 1956.
Keep your eye open for our MACD Buy Signal and be leery of election decision delays, congressional inability to pass another stimulus package and a continued rise in covid-19 cases, hospitalizations and deaths that could increase restrictions and weigh on the market.
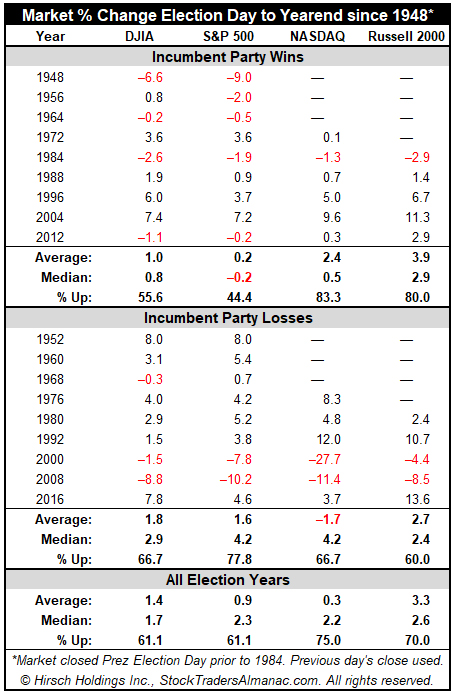
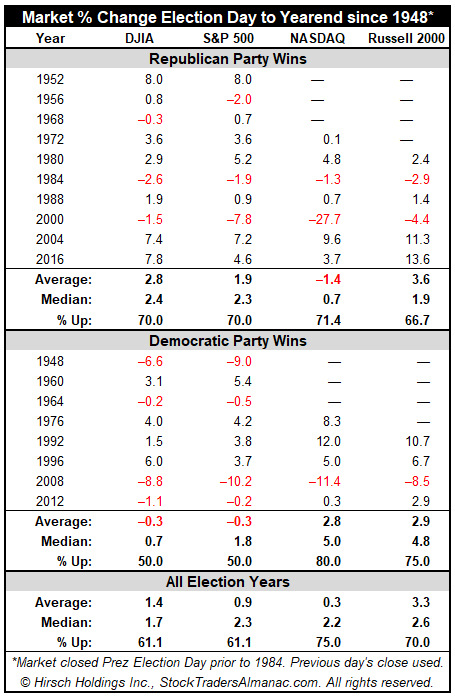
Market Performance Election Day to Yearend
In this particularly heated election season party bosses and constituents have closed ranks and dug in their heels – as have the candidates. In the meantime Wall Street soldiers on. From the March pandemic lows stocks were on a tear until seasonal forces returned to the fray and instigated a correction in historically weak September/October.
Then the turn of the month from the end of September through the first eight days of October exhibited its usual strength. As the battle for the White House is coming down to the wire a combination of typical mid-October weakness collided with an uptick in jobless claims, faltering stimulus talks and fears of a second wave of the COVID pandemic as cases and hospitalizations are on the rise worldwide.
We are all looking for an expeditious decision on the U.S. Presidential Election. The fear of a prolonged election decision process like we had in the 2000 election is at the forefront of everyone’s mind. In an effort to alleviate investor anxiety we have laid out here the history of market performance from Election Day to year end for the Dow, S&P 500, NASDAQ and the Russell 2000 small cap index. We’ve broken it out into two tables. One compares index returns for Incumbent Presidential Party Wins vs. Losses and the other for Republican vs. Democratic Presidential wins.
DJIA and S&P have a longer history and show greater weakness after the election when incumbent party wins with DJIA up 55.6% of the time for on average gain of 1.0%. S&P is notable weaker, up only 44.4% of the time with an average gain of 0.2%, and a median loss of -0.2%, A post-WWII consolidation bear market that started in June 1948 is mostly responsible.
Election years with incumbent party losses have produced better returns for Dow and S&P, but the impact of the undecided election in 2000 and The Great Recession and Financial Crisis in 2008 hit all indices hard with NASDAQ suffering the most. NASDAQ tech stocks and Russell 2000 small cap stocks have historically exhibited much more strength in November and December often outperforming DJIA and S&P large cap blue chip stocks. This is clearly evident in all tables.
Looking at the breakdown along party lines the numbers are rather close with 1948 and 2008 causing the most damage to Democratic wins and 2000 taking the wind out of Republican victories. The overall year end strength of NASDAQ tech stocks and the Russell 2000 small caps seems to be the prevailing trend.
NOV
2020