

The bulls had a good week, but the bear market does not appear over to us. When the market rallies and bounces around off bear market lows and commentary runs the gamut from permabear doomsayers to bottom callers it reminds us of the canny words our friend Dan Turov, who runs Turov on Timing, wrote twenty-one years ago this week in Barron’s.
“Bear markets don’t act like a medicine ball rolling down a smooth hill. Instead, they behave like a basketball bouncing down a rock-strewn mountainside; there’s lots of movement up and sideways before the bottom is reached.”
For now, we believe it looks like the market is set for one of those bear market bounces. MACD has rolled over to buy on all three of the major indexes (DJIA, S&P 500 and NASDAQ) for the first time in almost two months since the Stock Trader’s Almanac April 7 Sell Signal. And it is both MACDs we track. The shorter-term 8-17-9 MACD Buy indicator and the longer-term 12-26-9 MACD Sell indicator have both turned positive on all three indexes.
In the May and June Almanacs on pages 48 and 58 of the 2022 Stock Trader’s Almanac you will notice the bullish tendency during the last few days of May and the first couple of June. For further detail on these days check the “Recent Market Probability Calendars” in the “Directory of Trading Patterns and Databank” on pages 123-130.
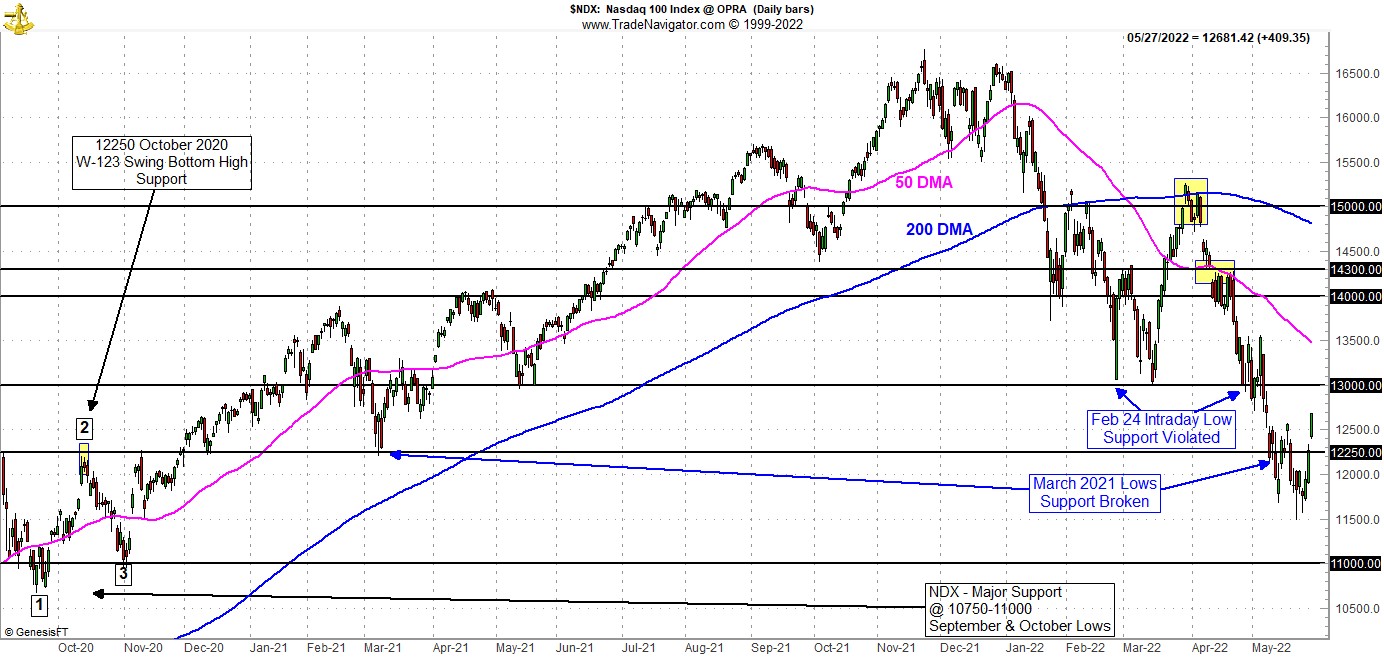
Ok, so how far can this bear market rally run? The level that jumps out at us is that February 24 intraday low on the first day of the Russian invasion of Ukraine. It also aligns with the March 14 low on NASDAQ Composite and NDX (NASDAQ 100 Index) as you can see in the chart below of the NDX. This equates to about 4100 on the S&P 500 or about 5% from the recent low. 32500 on the Dow looks reachable. A bounce of 10% to NASDAQ 12500 and NDX 13000 is not inconceivable. It could run a bit higher depending on the index.
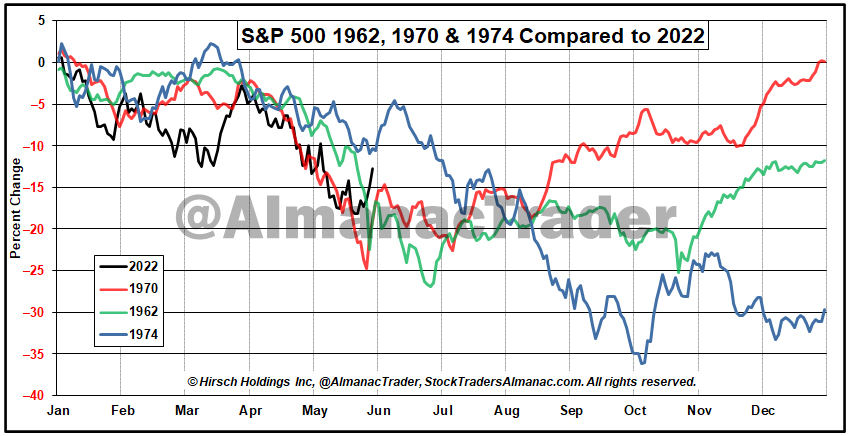
In the other graph below comparing 2022 to 1962, 1970 and 1974 the S&P bounced about 10% in 1970 and 1962 from the respective May and June lows before retreating and retesting. Yes, May was the low in 1970, which would be great, but history rhymes it does not repeat exactly. And the bear market that ended May 26, 1970 had lost 36% on the Dow and S&P from the high a year and a half prior in late 1968.
Technical Support Broken
But the reality of the situation is that support has been broken across the board. The chart below of our favorite leading benchmark NASDAQ 100 Index (NDX) has violated critical support levels at 13000 and 12250 and looks headed toward the old 2020 lows around 11000, which would be a 33.6% fall from its November 2021 high. NASDAQ Composite’s chart and scenario is similar. DJIA and S&P exhibit some more solid support at the 50% Fibonacci retracement level around S&P 3500 and DJIA 27700, which would be a drop of about 27.0% for S&P and 24.7% for DJIA from their respective all-time highs.
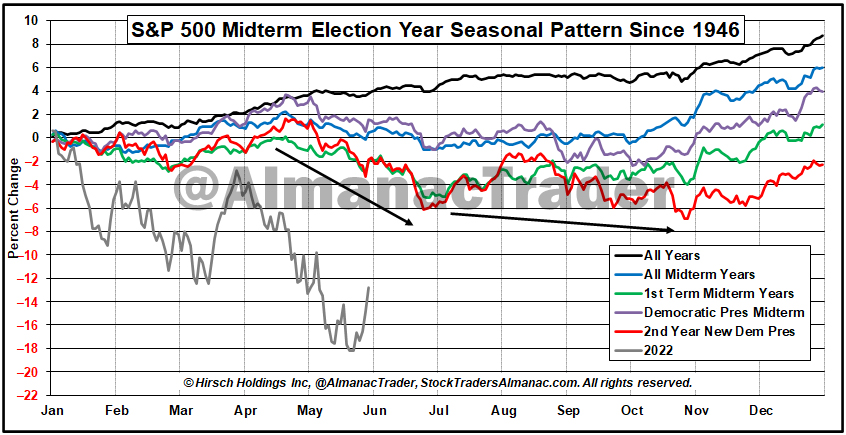
Let’s turn to the midterm election year pattern for the S&P 500 we have been tracking all year. Since the May Outlook we had to expand the lower range of the vertical axis 6 percentage points to accommodate the market’s slide in May. 2022 continues to track the seasonal trend of midterm election years, especially the two more ominous patterns of 1st term midterm years and the 2nd year of new Democratic presidents with late Q2 lows and a retest or lower low in October.
But remember as we highlighted in last month’s outlook, in addition to this being the Worst Six Months of the year for DJIA and S&P (May-October) with NASDAQ’s Worst Four Months (July-October) around the corner, it is also the “Weak Spot of the 4-Year Cycle,” which runs through Q2-Q3 of the midterm year. Since 1949 DJIA averages -1.2% over the two quarters and S&P averages -1.5%. NASDAQ averages a 5.0% loss during this weak spot.
However, now here comes the good news, this seasonal/cycle weakness sets up “The Sweet Spot of the 4-Year Cycle,” where the Dow and S&P average a gain of about 20% over the three-quarter span from Q4 midterm year to Q2 pre-election year – NASDAQ averages 29.3% in the sweet spot. This is why we call Midterm Election Year’s “A Bottom Pickers Paradise.” From the midterm low to the pre-election year high DJIA has averaged gains of 46.8% and NASDAQ has averaged gains of a whopping 68.2%!
1962, 1970, 1974 & 2022
In our analysis of the similarities of 2022 to previous years below, we scrapped the 1960 comparison and added in 1962 and 1974. In the updated chart the market appears to be avoiding the May-1970-type low and shifting over to a trend that may track the 1962 pattern closer. Both 1962 and 1970 experienced sharp late-May/early-June rallies. The market never looked back in 1970, but in 1962 the market hit its low toward the end of June with a significant retest in October.
The 1974 comparison is still a possibility, but it’s a longshot for us as 1974 was at the end of a long, nearly 2-year bear market on the heels of the Arab Oil Embargo and our exit from the Vietnam War. One could extrapolate some geopolitical comparisons of 2022 to 1974, but if anything, 2022 is at a much earlier stage.
Sizing up all the technical, fundamental, geopolitical, monetary, seasonal, cycle and sentiment analysis in our 5-Disciplines approach, summarized in our “Market at a Glance,” our best assessment is that after the bear market rally runs its course, the market will likely bounce along sideways, testing the lows, setting 2022 up for a prototypical midterm bottom hitting its low point in late Q3 or early Q4 in the August-October period, just ahead of the midterm elections. Then we rally off that low into the sweet spot and beyond to new highs. For now, support has been broken, stick to the system, cash is king and wait for the fatter pitch.
JUN
2022