

Seasonal patterns continue to reassert themselves and that is positive for the probability of new highs by yearend. Typical September and early October weakness created a solid set up for our October 8 Seasonal MACD Buy Signal. Then late-October seasonal strength carried into early November before the usual pre-Thanksgiving weakness ensued. As we head into December, the market is trying to find its footing and we look for the market to shake off its current funk as it usually does and rally into the year-end holiday buying spirt.
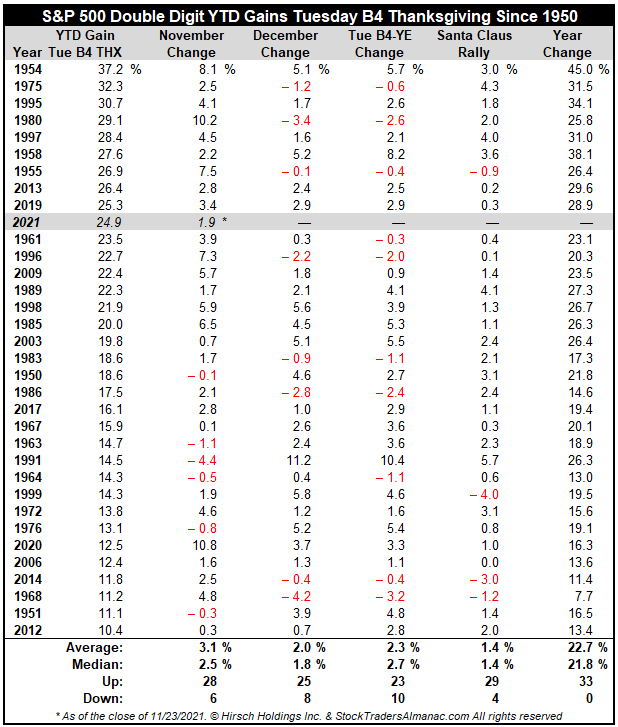
As the S&P 500 is up rather impressively, 24.9% year-to-date this year through the close on the Tuesday before Thanksgiving, we ran the numbers on the 33 previous years with double digit year-to-date gains at this juncture since 1950. There are a few blemishes, but in general market gains continued into yearend.
Most importantly, there are no major selloffs on this list. The big December decline of -9.2% in 2018 came after the S&P 500 was down -1.2% at this point in the year. After double-digit YTD gains the S&P 500 was up 70% of the time from the Tuesday before Thanksgiving to yearend for an average gain of 2.3%.
Also of note is that the Santa Claus Rally suffered only four losses in these years. But these four down SCRs in 1955, 1968, 1999 and 2014 were followed by flat years in 1956 and 2015 and down years in 1969 and 2000. As Yale’s famous line states (2021 Almanac page 116 and 2022 Almanac page 118): “If Santa Claus Should Fail To Call, Bears May Come to Broad and Wall.”
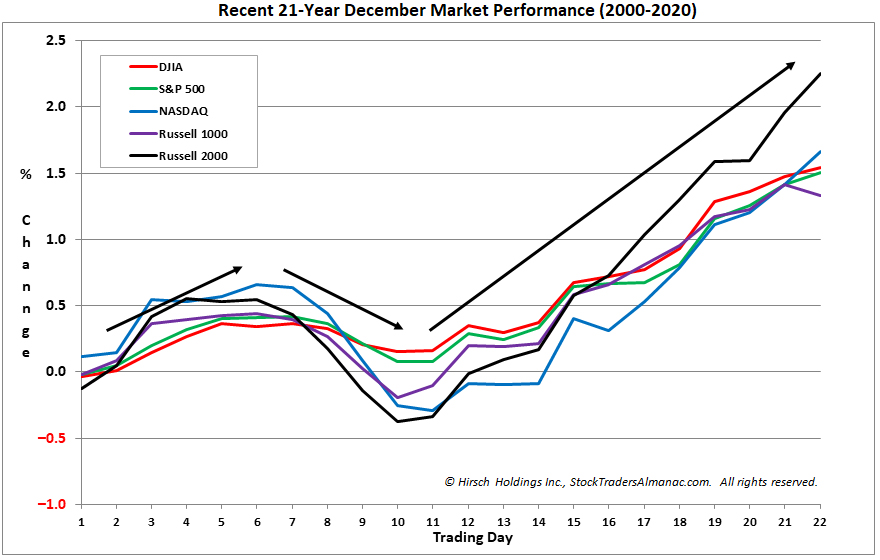
December typically starts out weak as tax-loss selling ramps up and with the big gains this year we believe that early December weakness is likely to materialize. Then as you can see in the typical December chart here stocks usually begin to takeoff around mid-month led by small caps and the Russell 2000.
This is what used to be known as the “January Effect:” small caps outperforming large caps in the month of January. Nowadays most of the so-called January Effect tends to take place in the last half of December (2021 Almanac pages 110 & 112, 2022 pages 112 & 114). The January Effect is not to be confused with the January Barometer (2021 Almanac page 16, 2022 page 18), which states as the S&P 500 goes in January, so goes the year.
The Santa Claus Rally was defined by Yale Hirsch in 1972 as the last five trading days of the year and the first two trading days of the New Year. This short, sweet rally is usually good for about 1.3% on the S&P 500, but as we alluded to before the real significance of the SCR is as an indicator.
It is our first seasonal indicator of the year ahead. Years when there was no Santa Claus Rally tended to precede bear markets or times when stocks hit significantly lower prices later in the year. We get an even better indication of the New Year when we combine SCR with the First Five Days Early Warning System (2021 Almanac page 14, 2022 page 16) and the full-month January Barometer reading. We call this the “January Indicator Trifecta.”
When all three are up the S&P 500 has been up 90% of the time, 28 of 31 years, with an average gain of 17.5%. When any of them are down the year’s results are reduced and when all three are down the S&P was down 3 of 8 years with an average loss of -3.6% with bear markets in 1969 (-11.4%), 2000 (-10.1%) and 2008 (-38.5%), flat years in 1956 (2.6%), 1978 (1.1%) and 2005 (3.0%). Down Trifecta’s were followed by gains in 1982 (14.8%) and 2016 (9.5%).
Our outlook remains bullish for the remainder of 2021 and as long as Covid cases don’t explode again and many places go on lockdown or ramp up restrictions majorly, new highs are likely before yearend and we would not be surprised to see the S&P 500 encroach upon the big round number of 5000. 2022 will likely be a different case and we will address that thoroughly in our 2022 Annual Forecast next month.
DEC
2021