

Stocks have been on the rise since the late-October lows in prototypical market seasonality fashion, though NASDAQ has lagged a bit. Honestly, NASDAQ tech stocks deserve a break, they have carried the market for months now as they have driven and supported the stay-at-home economy. This rotation into the reopening-economy big cap stocks and the new highs in the Russell 2000 small caps, which are more domestic-based firms, is encouraging.
The Russell 2000 index of small cap stocks is on a tear, up 18.3% for November alone and hitting a new all-time high in the process. DJIA and NASDAQ are running a distant second for November, though up an impressive 11.8% each. S&P 500’s 10.8% November gain is nothing to scoff at either. This is a top-20 monthly percent gain of all time for DJIA and 22nd best for S&P 500 – 3rd best DJIA November and #1 S&P November; and NASDAQ’s 23rd best month and 3rd best November. And last but surely not least, this is the Best Russell 2000 Month of all time.
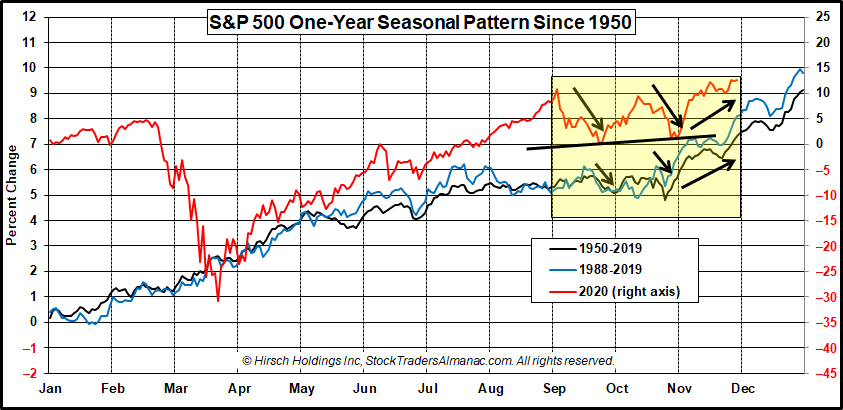
From the close on November 5, 2020 when our Best Six/Eight Months Seasonal MACD Buy Signal triggered, the major indices are up respectably as well: DJIA +4.4%, S&P 500 +3.2%, NASDAQ +2.6% and Russell 2000 +9.6%. This continues the return of seasonality we discussed last month. November’s seasonal upside bias is quite clear in the updated chart here of S&P 500 for 2020 (right axis) overlaid on the One-Year Seasonal Pattern since 1950 and 1988 (left axis).
November 2020 strength comes on the heels of the perennial September and October weakness we experienced this year, which tracks historical patterns over the past 70-year and 32-year timeframes. With some vision now in the rearview mirror it appears S&P has made a classic late-October low. This October low was also a slightly higher-low than the September low and forms an uptrend line of support.
Before we get too far ahead of ourselves, it pays to remember that the first half of December is often weaker than the latter half, which is also when small cap stocks begin to outperform large caps (the old “January Effect”, not to be confused with our January Barometer). However, Russell 2000 November gains may be difficult to outdo.
Then there’s the usually strong Triple Witching Week and Week After. Our Santa Claus Rally (SCR) begins on Christmas Eve, December 24. The SCR is the last 5 trading days of the year and the first 2 of the New Year and is the first indication of the year to come. To Wit: “If Santa Claus should fail to call, Bears may come to Broad and Wall.
Yearend bullish seasonality is being buoyed higher by vaccine optimism and news that the Trump administration has officially authorized the Biden transition. And the market seems to be pleased with how Biden has been preparing his administration and his cabinet selections. There is also renewed hope for another stimulus package. We are encouraged by how resilient the market has remained in the face of rising COVID-19 cases – a testament to the promise of the medical solutions on the horizon and that we are better prepared for any new economic restrictions. The stay-at-home economy seems to be fusing with the reopening economy and this is positive for the market going into yearend and 2021.
DEC
2020