
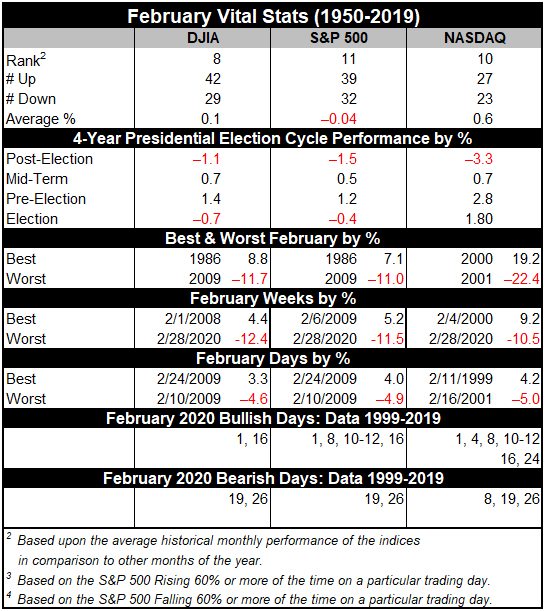
Even though February is right in the middle of the Best Six Months, its long-term track record, since 1950, is rather tepid. February ranks no better than sixth and has posted meager average gains except for the Russell 2000. Small cap stocks, benefiting from “January Effect” carryover; tend to outpace large cap stocks in February. The Russell 2000 index of small cap stocks turns in an average gain of 1.0% in February since 1979—just the sixth best month for that benchmark.
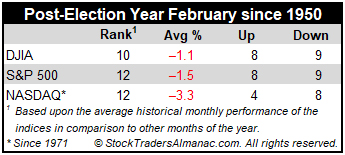
February’s post-election year performance since 1950 is miserable, ranking dead last for S&P 500, NASDAQ and Russell 2000. Average losses have been sizable: -1.5%, -3.3% and -1.6% respectively. February ranks tenth for DJIA in post-election years with an average loss of 1.1%. February 2001 and 2009 were exceptionally brutal. NASDAQ dropped 22.4% in February 2001, its third worst monthly loss ever.
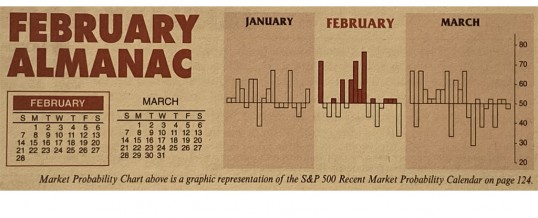
The first trading day is bullish for DJIA, S&P 500 and NASDAQ. Average gains on the first day over the last 21-year period are right around 0.44%. Strength then tends to fade after that until the stronger sixth, eighth, ninth and eleventh trading days.
Presidents’ Day is the lone holiday that exhibits weakness the day before and after (Stock Trader’s Almanac 2021, page 98). The Friday before this mid-winter three-day break can be treacherous and average declines persist for three trading days after the holiday going back to 1980. In recent years, trading before and after the holiday has been more bullish. S&P 500 has been up 9 of the last 10 years on the day before and NASDAQ has been up 7 of the last 8 years on the day after.
Last year’s Presidents’ Day week was the market’s turning point as Covid-19 rapidly spread around the globe. All five indexes suffered double-digit losses in the last week of February.
FEB
2021