
Money flows from harvesting made August a great stock market month in the first half of the Twentieth Century. It was the best month from 1901 to 1951. In 1900, 37.5% of the population was farming. Now that less than 2% farm, August is amongst the worst months of the year. It is the worst DJIA, S&P 500, NASDAQ, Russell 1000 and Russell 2000 month over the last 32 years, 1988-2019 with average declines ranging from 0.1% by NASDAQ to 1.1% by DJIA.
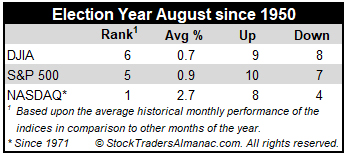
However, in election years since 1950, Augusts’ rankings improve: #6 DJIA, #5 S&P 500, #1 NASDAQ (since 1971), #1 Russell 1000 and #1 Russell 2000 (since 1979). This year, the market’s performance in August will likely depend heavily on how July closes and whether or not the rate of covid-19 infection continues to accelerate which could force some areas to roll back reopening plans.
Contributing to this poor performance since 1987 is the second shortest bear market in history (45 days) caused by turmoil in Russia, the Asian currency crisis and the Long-Term Capital Management hedge fund debacle ending August 31, 1998 with the DJIA shedding 6.4% that day. DJIA dropped a record 1344.22 points for the month, off 15.1%—which is the second worst monthly percentage DJIA loss since 1950. Saddam Hussein triggered a 10.0% slide in August 1990. The best DJIA gains occurred in 1982 (11.5%) and 1984 (9.8%) as bear markets ended. Sizeable losses in 2010, 2011, 2013 and 2015 of over 4% on DJIA have widened Augusts’ average decline.
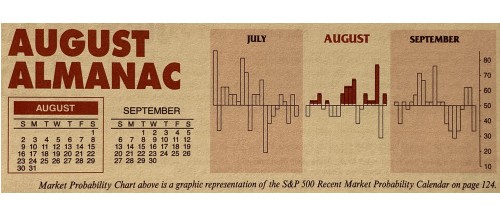
The first nine trading days of the month have exhibited weakness while mid-month is better. Note the bullish cluster from August 17 through 19. The end of August tends to get whacked as traders evacuate Wall Street for the summer finale. The last five days have declined in 13 of the last 24 years with the S&P 500 up only seven times on the penultimate day in the past 24 years. In the last 24 years, the last five days of August have averaged losses of: Dow Jones Industrials, –0.7%; S&P 500, –0.6% and NASDAQ, –0.2%.
On Monday of expiration the Dow has been up 16 of the last 25 years with four up more than 1%, while on expiration Friday it has dropped in 7 of the last 10 years. Expiration week is down slightly more than half the time since 1990, but some of the losses have been steep (-2.6% in 1990, -2.3% in 1992, -4.2% in 1997, -4.0% in 2011, -2.2% in 2013 and -5.8% in 2015). The week after expiration is mildly stronger up 18 of the last 30.

AUG
2020