

Hold the champagne! This is not the longest bull market on record or since WWII as the current buzz on The Street would have you believe. On August 22, 2018 some market analysts will deem this the longest bull market on record having avoided an “official” 20% bear market for 3453 calendar days, surpassing the October 11, 1990 to March 24, 2000 bull market – but we respectfully disagree.
We have tracked bull and bear markets with objectivity for more than 5 decades in the Stock Trader’s Almanac and the 52nd annual edition, the 2019 Almanac, will be out this fall. Along with many others we do not subscribe to this arbitrary 20% decline definition.
In reality bull and bear markets are more nuanced than an arbitrary level like 20%. Why 20%? Why not 18% or 17.5%? Perhaps it has something to do with classic usury or loan shark rates charging a fifth or 20% of the principal dollar amount lent. Or maybe folks just like big round numbers.
Even if we allow for this arbitrary 20% definition, as our esteemed colleague Sam Stovall at CFRA said in his Monday missive, “It can’t be called the longest bull until it sets a new all-time high on or after 8/22.” But the dude does not abide. We have long relied on the more accurate and widely accepted Ned Davis Research definition:
A Bull Market requires a 30% rise in the Dow Jones Industrial Average after 50 calendar days or a 13% rise after 155 calendar days. Reversals of 30% in the Value Line Geometric Index since 1965 also qualify.
A Bear Market requires a 30% drop in the Dow Jones Industrial Average after 50 calendar days or a 13% decline after 145 calendar days. Reversals of 30% in the Value Line Geometric Index also qualify. This applied to the 1987, 1990 and 1998 high and low.
Bull and bear markets are measured at peak and trough dates, so both the time and price criteria must be met as of the peak and trough dates.
In fact the logic of using the October 11, 1990 date as the beginning of the “last” bull is flawed. In the bear market that went from July 16, 1990 to October 11, 1990 the S&P 500 only suffered a 19.92% decline, not 20%. Why not count the 20% intraday S&P 500 decline in 2011? You get the point.
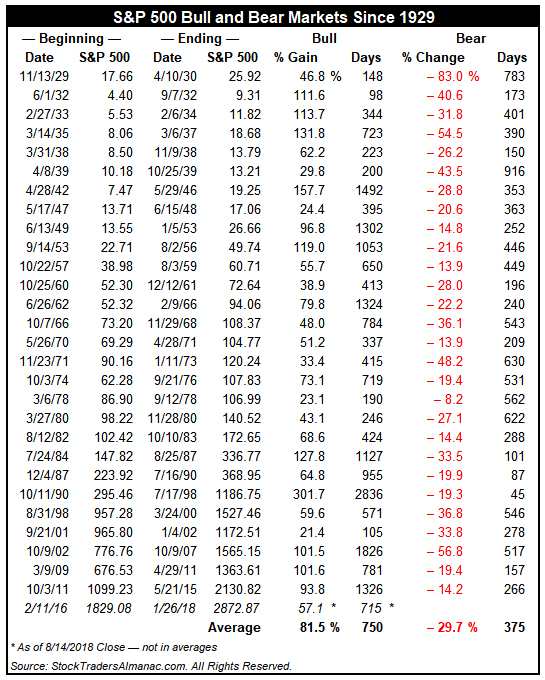
Updated in the table below from page 132 of the Stock Trader’s Almanac are all the bull and bear markets for the S&P since 1929, including the shortest bear market on record (45 days) that ended on August 31, 1998 and the two most recent that ended on October 3, 2011 and February 11, 2016.
If you really want to use the hard 20% rule the last longest bull began on December 4, 1987 and ended on March 24, 2000 at 4494 calendar days. To top that the “current’ bull that began on March 9, 2009 would have to run until June 28, 2021 to top it.
Using Ned Davis rules the longest bull began on October 11, 1990 and ran for 2836 calendar days until July 17, 1998. The current bull that began on February 11, 2016 would have to run until November 17, 2023 to beat it.
Far be it from me to prevent anyone from celebrating or having some champagne, but please do so with the knowledge that this bull may be younger than you think.
AUG
2018