Posts Tagged 'Russell 2000'

Almanac Update April 2022: DJIA Up 16 in a Row

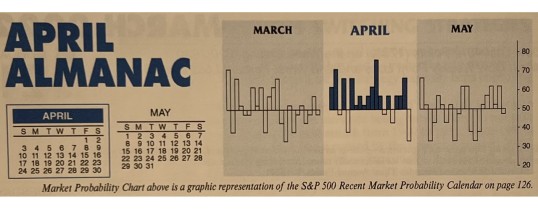
April marks the end of the “Best Six Months” for DJIA and the S&P 500. The window for the Stock Trader’s Almanac Seasonal MACD sell signal opens on April 1st. From the Stock Trader’s Almanac Seasonal MACD Buy Signal on October 8, 2021, through the March 31 close, DJIA is down 0.2% while S&P 500 is up 3.2%. This is below historical average performance due largely to surging inflation, a tightening Fed and Russia’s invasion of Ukraine. But before the ...

Continue Reading →
0

Almanac Update March 2022: Stronger in Midterm Years

As part of the Best Six/Eight Months, March has historically been a solid performing month with DJIA, S&P 500, and NASDAQ all advancing more than 62% of the time with average gains ranging from 0.6% by NASDAQ to 1% by S&P 500. Over the recent 21-year period, March has tended to open well with gains accumulating over its first three trading days. Temporary weakness follows before moving modestly higher into mid-month through month’s end.

Julius Caesar failed to heed the famous ...

Continue Reading →
0

Almanac Update February 2022: Historical Performance Improves in Midterm Years

Even though February is right in the middle of the Best Six Months, its long-term track record, since 1950, is rather tepid. February ranks no better than sixth and has posted meager average gains except for the Russell 2000. Small cap stocks, benefiting from “January Effect” carry over; historically tend to outpace large cap stocks in February. The Russell 2000 index of small cap stocks turns in an average gain of 1.1% in February since 1979—just the sixth best month ...

Continue Reading →
0

Almanac Update January 2022: Indicator Trifecta Could Reshape 2022

January has quite a reputation on Wall Street as an influx of cash from yearend bonuses and annual allocations has historically propelled stocks higher. January ranks #1 for NASDAQ (since 1971), but fifth on the S&P 500 and DJIA since 1950. January is the last month of the best three-month span and holds a full docket of indicators and seasonalities.

DJIA and S&P rankings did slip from 2000 to 2016 as both indices suffered losses in ten of those seventeen Januarys ...

Continue Reading →
0

Almanac Update December 2021: Small Cap Effect & Santa Claus Rally

December is the number three S&P 500 and Dow Jones Industrials month since 1950, averaging gains of 1.5% on each index. It’s the second-best Russell 2000 (1979) month and third best for NASDAQ (1971). In 2018, DJIA suffered its worst December performance since 1931 and its fourth worst December going all the way back to 1901. However, the market rarely falls precipitously in December and a repeat of 2018 is not all that likely. When December is down it is ...

Continue Reading →
0

Almanac Update November 2021: Best Consecutive Three-Month Span Begins

November maintains its status among the top performing months as fourth-quarter cash inflows from institutions drive November to lead the best consecutive three-month span November-January. However, the month has taken hits during bear markets and November 2000, down –22.9% (undecided election and a nascent bear), was NASDAQ’s second worst month on record—only October 1987 was worse.

November begins the “Best Six Months” for the DJIA and S&P 500, and the “Best Eight Months” for NASDAQ. Small caps come into favor during ...

Continue Reading →
0

Almanac Update June 2020: End of NASDAQ’s “Best Eight Months”

June has shone brighter on NASDAQ stocks over the last 49 years as a rule ranking seventh with a 0.8% average gain, up 27 of 49 years. This contributes to NASDAQ’s “Best Eight Months” which ends in June. June ranks near the bottom on the Dow Jones Industrials just above September since 1950 with an average loss of 0.2%. S&P 500 performs similarly poorly, ranking tenth, but essentially flat (0.1% average gain). Small caps also tend to fare well in ...

Continue Reading →
0
Page 2 of 2 12