Posts Tagged 'NASDAQ'

Almanac Update April 2021: Top DJIA Month – Up 15 in a Row

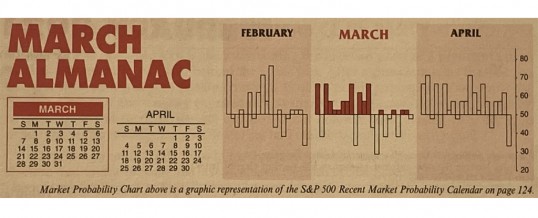
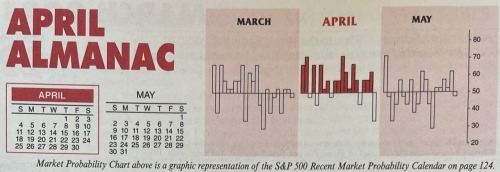
April marks the end of the “Best Six Months” for DJIA and the S&P 500. The window for our seasonal MACD sell signal opens on April 1st. From our Seasonal MACD Buy Signal on November 5, 2020 through the close on March 25, 2021, DJIA was up 14.9% and S&P 500 had advanced 11.4%. These above average gains are encouraging and suggest seasonality is back on track after getting derailed by Covid-19 last year.

April 1999 was the first month to ...

Continue Reading →
0

April 2021 Outlook: Late-March Weakness Sets Up End of Best Six Months Rally

The last month of our “Best Six Months” is now upon us. So it’s the perfect time to provide a refresher for longtime readers and primer for those that have recently joined us. We do not simply “Sell in May and go away.” We employ a more nuanced and subtle approach to how we implement our Best & Worst Months Switching Strategies detailed in the annual Stock Trader’s Almanac and on www.stocktradersalmanac.com. We are Continue Reading →

0

April 2021 Market at a Glance

Seasonal:

Bullish. April is the last month of DJIA and S&P 500 “Best Six Months.” It is DJIA’s best month since 1950, second best S&P 500 and fourth for NASDAQ. DJIA has been up 15 Aprils in a row. Remain vigilant as our Seasonal MACD Sell for DJIA and S&P 500 can occur anytime on or after April 1.

Continue Reading →
0

Almanac Update March 2021: Softer in Post-Election Years

Tempestuous March markets tend to drive prices up early in the month and batter stocks at month end. Julius Caesar failed to heed the famous warning to “beware the Ides of March” but investors have been served well when they have. Stock prices have a propensity to decline, sometimes rather precipitously, during the latter days of the month. In March 2020, DJIA plunged nearly 4012 points (-17.3%) during the week ending on the 20th.

March packs a rather busy docket. It ...

Continue Reading →
0

March 2021 Outlook: Frothy Market Succumbs & Looks for Support In March

Unfortunately the February weakness we warned about last issue began to materialize mid-month and accelerated into month-end. The “excuse du jour” is rising bond yields as the 10-Year Treasury climbed above 1.5%. The reaction to the 10-Year yield moving above 1.5% could be a little overblown. It’s barely back to pre-Covid levels. Perhaps it’s more a sign of a healthy economy and rising inflation expectations, which is precisely what the Fed has been trying to foster. We’re not overly concerned ...

Continue Reading →
0

March 2021 Market at a Glance

Seasonal:

Bullish. March is normally a decent performing market month however post-election year payments to the Piper can take a toll on March as average historical gains are trimmed noticeably. In post-election years March ranks: #8 DJIA, S&P 500, and Russell 2000; NASDAQ is 4th worst with an average loss of 0.2%.

Continue Reading →
0

Almanac Update February 2021: Historically Weak in Post-Election Years

Even though February is right in the middle of the Best Six Months, its long-term track record, since 1950, is rather tepid. February ranks no better than sixth and has posted meager average gains except for the Russell 2000. Small cap stocks, benefiting from “January Effect” carryover; tend to outpace large cap stocks in February. The Russell 2000 index of small cap stocks turns in an average gain of 1.0% in February since 1979—just the sixth best month for that ...

Continue Reading →
0

February 2021 Outlook: Robinhood Thwarts January Indicator Trifecta, Watch Out For February Weakness

It’s been a dynamic six weeks since we made our Annual Forecast for 2021 and volatility spiked the last week of January as the merry Gen Z traders made on run on the shorts of the old guard on Wall Street. Robinhood Markets and other trading apps and services and online communities used by younger up-and-coming retail traders were able to organize en masse and create an old-fashioned short squeeze. You’ve got to hand it to ...

Continue Reading →
0

January 2021 Market at a Glance

Seasonal:

Bullish. January is the third month of the Best Six/Eight, but it is the last of the Best-Three-Consecutive-month span. January is the top month for NASDAQ (since 1971) averaging 2.8%, but it has slipped to sixth for DJIA and fifth for S&P 500 since 1950. Post-election-year Januarys have been weaker (DJIA +0.6%, S&P 500 +0.8% NASDAQ +2.3%), but still positive. ...

Continue Reading →
0
Page 7 of 19 «...56789...»