Posts Tagged 'NASDAQ'

November 2021 Market at a Glance

Seasonal:

Bullish. November is the first month of the “Best Six Months” for DJIA and S&P 500 and NASDAQ’s “Best Eight Months.” It’s also the first month of the market’s best three consecutive month span, November to January. November is the best S&P 500, Russell 1000 and 2000 month of the year. Second best for DJIA and S&P 500. In post-election years ...

Continue Reading →
0

November 2021 Outlook: Best Months & Yearend Rally Begins

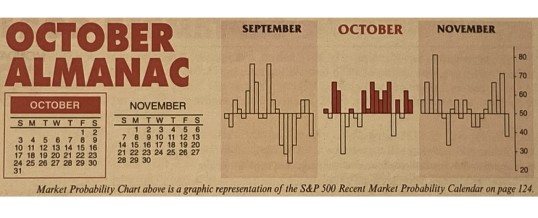
It looks as though the market has resisted Octoberphobia and averted the feared crashes or massacres that have given the month its bad reputation. More significantly for us though is the continuation of the return to normal seasonal patterns we began to see last month that had been off kilter through much of the pandemic. As you can see in the chart of the typical October pattern over the recent 21-year period stocks have tracked the seasonal pattern rather closely ...

Continue Reading →
0

October 2021 Outlook: Market Likely Wards Off October’s Curse?

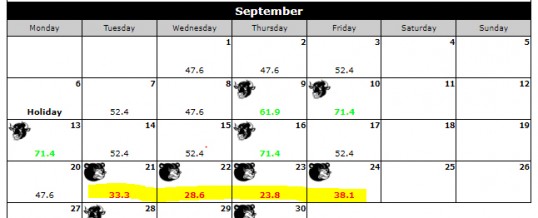
Well. Seasonality is back. Everyone in the financial media has been talking about September seasonal weakness lately. And here we are in September and the market has sold off around the 5% or so we projected last month. And it did so in the notoriously treacherous week after September quarterly options and futures expiration.

Then, as expected, traders and fund managers bought the 5% dip as they have throughout this bull market rally with the blessing of the Federal Reserve’s continuing ...

Continue Reading →
0

October 2021 Market at a Glance

Seasonal:

Improving. October is the last month of the “Worst Six Months” for DJIA and S&P 500 and the last month of NASDAQ’s “Worst Four Months”. In post-election years October ranks mid-pack with average performance ranging from 0.9% (DJIA) to 1.4% (NASDAQ). Keep an eye out for the Official MACD Seasonal Buy Signal. It can trigger anytime on or after October ...

Continue Reading →
0

Almanac Update October 2021: Resist “Octoberphobia”

October often evokes fear on Wall Street as memories are stirred of crashes in 1929, 1987, the 554-point drop on October 27, 1997, back-to-back massacres in 1978 and 1979, Friday the 13th in 1989 and the 733-point drop on October 15, 2008. During the week ending October 10, 2008, Dow lost 1,874.19 points (18.2%), the worst weekly decline in our database going back to 1901, in percentage terms. March 2020 now holds the dubious honor of producing the worst and ...

Continue Reading →
0

September 2021 Outlook: End of Q3 Has Been Challenging

Aloha friends. We’ve seen a lot these past two weeks in Hawaii from snorkeling with sea turtles and swimming in waterfalls on Maui to the southernmost point in the U.S. and Kilauea Caldera on the Big Island, then to surfing Hanalei Bay and hiking the Na Pali Coast in Kauai and now Waikiki Beach on Oahu for the last leg of the trip. We will be heading to Pearl Harbor National Memorial and Banzai Pipeline before heading home. We joke ...

Continue Reading →
0

September 2021 Market at a Glance

Seasonal:

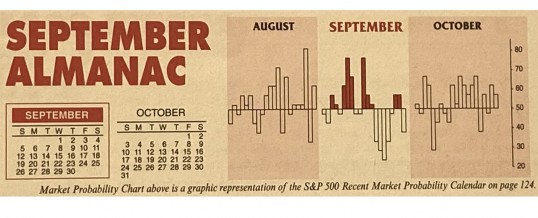
Bearish. September is the worst DJIA, S&P 500, NASDAQ, Russell 1000 and Russell 2000 month. Average declines range from –0.4% from Russell 2000 to –0.7% by DJIA. In post-election years since 1950, September is still ranked no higher than #9 while average performance remains negative with only a modest improvement.

Continue Reading →
0

Almanac Update September 2021: Worst Month of Year Over Last 71 Years

Start of the business year, end of summer vacations, and back to school once made September a leading barometer month in the first 60 years of 20th century, now portfolio managers back after Labor Day tend to clean house. Since 1950, September is the worst performing month of the year for DJIA, S&P 500, NASDAQ (since 1971), Russell 1000 and Russell 2000 (since 1979). After four solid years from 1995-1998 during the dot.com bubble buildup, S&P 500 was down five ...

Continue Reading →
0

August 2021 Outlook: Rally Primed To Pause in Worst Months

Our outlook for the full year remains clearly bullish, more in line with the best cast scenario of our Annual Forecast in the January 2021 issue. S&P 500 is already up about 17% so far this year at the end of July. Our updated outlook is for S&P 500 to finish the year in the 4500-4600 range or even higher, but we do anticipate the rally to pause over the next 2-3 months during the worst two ...

Continue Reading →
0

August 2021 Market at a Glance

Seasonal:

Bearish. August is the worst DJIA and S&P 500 month during 1988-2020 and second worst for NASDAQ. In post-election years since 1950, August is still ranked no higher than #11 while average performance slips deeper into negative territory. The Summer Volume Doldrums historically span all of August as traders and investors escape the office and head out on vacations.

Continue Reading →
0

Page 5 of 19 «...34567...»