Posts Tagged 'NASDAQ'

Almanac Update September 2018: Midterm Elections Further Quell Returns

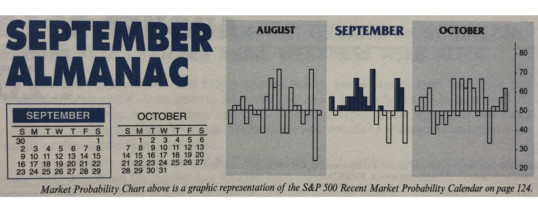
Since 1950, September is the worst performing month of the year for DJIA, S&P 500 and NASDAQ (since 1971). September was creamed four years straight from 1999-2002 after four solid years from 1995-1998 during the dot.com bubble madness. Although September’s overall rank improves modestly in midterm years going back to 1950, average losses widen for DJIA (–1.0%) and NASDAQ (–0.8%). S&P 500’s average September loss improves slightly from –0.5% to –0.4% in midterm years. Although September 2002 does influence the ...

Continue Reading →
0

September 2018 Market at a Glance

Seasonal:

Bearish. September is the worst performing month of the year for DJIA, S&P 500, NASDAQ (since 1950), Russell 1000 and Russell 2000 (since 1979). In midterm years going back to 1950, average losses widen for DJIA (–1.0%), NASDAQ (–0.8%), Russell 1000 (–1.1%) and Russell 2000 (–0.6%). S&P 500’s average September loss improves slightly from –0.5% to –0.4% in midterm years.

Continue Reading →
0

Market Outlook September 2018: Tumultuous Month Often Bucks Bulls Off Easy Ride

Midterm years are notoriously a rough year for markets as presidents push through their most disruptive policy initiatives and battle the opposition party to retain congressional seats. But the last three midterm years, 2006, 2010 and 2014 have been strong followed by troubled pre-election years. 2007 brought us the major top of the Financial Crisis with the S&P up 3.5%. 2011 suffered a mini-bear from April to October that shaved 19.4% off the S&P, which ended the year down a ...

Continue Reading →
0

Almanac Update August 2018: Worst Month of the Year

Money flows from harvesting made August a great stock market month in the first half of the Twentieth Century. August was the best month from 1901 to 1951. In 1900, 37.5% of the population was farming. Now that less than 2% farm, August is amongst the worst months of the year. It is the worst DJIA and S&P 500 month since 1987 with average declines of 1.0% and 0.8% respectively. August is also the worst month for NASDAQ (–0.1%) over ...

Continue Reading →
0

Market Outlook August 2018: Hot Julys Often Bring Late-Summer/Autumn Buys

Geopolitical concerns over the past few months from snafus and issues at the U.S. southern border over immigration disputes to tough tariff talk and trade war concerns have been shrugged off by the market since the end of June. Positive Q2 earnings, rising GDP growth, sustained unemployment and low rates continue to please the market, sending the market higher in July. This put DJIA up 4.00%, S&P 500 up 3.75% and NASDAQ up 4.40% for the month of July so ...

Continue Reading →
0

August 2018 Market at a Glance

Seasonal:

Bearish. August is the worst month of the year since 1988. Average losses over the last 30 years range from 0.3% by NASDAQ to 1.2% by DJIA. In midterm years since 1950, Augusts’ rankings improve slightly: #8 DJIA, #9 S&P 500, #11 NASDAQ (since 1974). Average losses range from 0.4% for S&P 500 to 1.8% for NASDAQ. DJIA suffered double-digit ...

Continue Reading →
0

August’s First Trading Day Not So Great

From the Stock Trader’s Almanac 2018 (page 86), it is known that the first trading days of each month combined gain nearly as much as all other days combined. However, the first trading day of August does not contribute to this phenomenon ranking worst among other First Trading Days in the 2018 Almanac and even after a modestly positive performance last year it is still the last in the upcoming 2019 edition of the Almanac. In the ...

Continue Reading →
0

Flat-Lining Advance/Decline Lines Flash Warning

At the open of trading today all the major indexes were all in positive territory, but by the closing bell only DJIA and S&P 500 remained in the green for the day, up 0.8% and 0.5% respectively. NASDAQ finished basically flat on the day after surrounding early-day gains in excess of 1%. Russell 2000 had the toughest day, closing down slightly less than 1.1%. This is a reversal of the trend that existed through much of June and the first ...

Continue Reading →
0

Hot July Market Blazes Past Historical Performance

As of today’s close DJIA is up 3.18% thus far in July. S&P 500 is slightly better at 3.26% while Russell 2000 is up 3.37%. NASDAQ is best up 4.41% with another six trading sessions to go in the month. As you can see in the chart below this is well above average historical July performance at this point of the month over the last 21 years. Early month strength (trading days three, four and five) was substantially greater this ...

Continue Reading →
0

July 2018 Market at a Glance

Seasonal:

Bearish. July historically is the best performing month of the third quarter however, the mostly negative results in August and September make the comparison easy. July begins NASDAQ’s worst four months and is the third weakest performing NASDAQ month since 1971, posting a 0.4% average gain. Midterm-year July rankings are something of a mixed bag, ranking #5 for DJIA and ...

Continue Reading →
0
Page 17 of 19 «...101516171819