Posts Tagged '$^GSPC'

Market Outlook September 2018: Tumultuous Month Often Bucks Bulls Off Easy Ride

Midterm years are notoriously a rough year for markets as presidents push through their most disruptive policy initiatives and battle the opposition party to retain congressional seats. But the last three midterm years, 2006, 2010 and 2014 have been strong followed by troubled pre-election years. 2007 brought us the major top of the Financial Crisis with the S&P up 3.5%. 2011 suffered a mini-bear from April to October that shaved 19.4% off the S&P, which ended the year down a ...

Continue Reading →
0

Market Outlook August 2018: Hot Julys Often Bring Late-Summer/Autumn Buys

Geopolitical concerns over the past few months from snafus and issues at the U.S. southern border over immigration disputes to tough tariff talk and trade war concerns have been shrugged off by the market since the end of June. Positive Q2 earnings, rising GDP growth, sustained unemployment and low rates continue to please the market, sending the market higher in July. This put DJIA up 4.00%, S&P 500 up 3.75% and NASDAQ up 4.40% for the month of July so ...

Continue Reading →
0

August’s First Trading Day Not So Great

From the Stock Trader’s Almanac 2018 (page 86), it is known that the first trading days of each month combined gain nearly as much as all other days combined. However, the first trading day of August does not contribute to this phenomenon ranking worst among other First Trading Days in the 2018 Almanac and even after a modestly positive performance last year it is still the last in the upcoming 2019 edition of the Almanac. In the ...

Continue Reading →
0

Market Outlook July 2018: June Swoon Indicates Time to Take More Risk Off For Summer

So far our June 21 NASDAQ Best 8 Months Sell Signal has turned out to be rather timely. From our November 28 Buy Signal to our June 21 Sell Signal NASDAQ gained 11.6%. NASDAQ has given back sizeable ground since June 21. The Dow and S&P 500 have been in selloff mode a bit longer since June 13.

We have been getting on the defensive since our May 2 Dow and S&P 500 Best Six Months Sell signal and it now ...

Continue Reading →
0

Market Outlook June 2018: Best 8 Months End, Midterm Machinations Suggest Rough Summer for Stocks

To all the market seasonality naysayers and “Sell in May” or Best Six Months/Worst Six Months critics, we say thank you for your skepticism. Despite your disbelief (and perhaps because of it) the recurring seasonal market patterns highlighted in the Stock Trader’s Almanac continue to persist. Of course they are not perfect and do not work 100% of the time, and some have fallen by the wayside and some have shifted – we’ve tracked and updated those.

However, supported by a ...

Continue Reading →
0

Almanac Update June 2018: Worst Month in Midterm Years

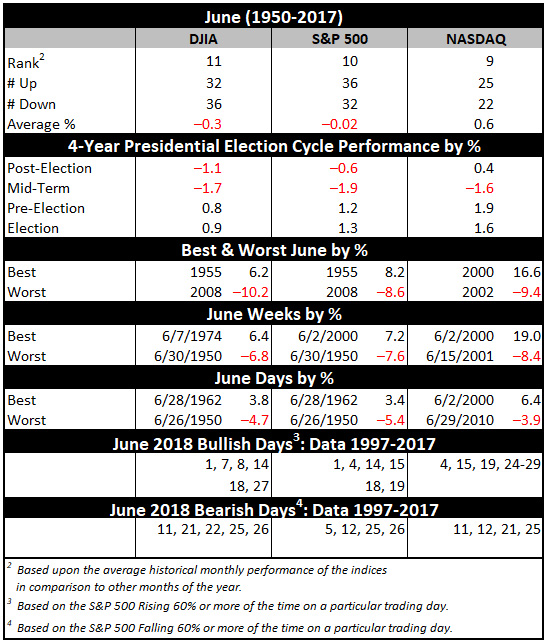
June has shone brighter on NASDAQ stocks over the last 47 years as a rule ranking ninth with a 0.6% average gain, up 25 of 47 years. This contributes to NASDAQ’s “Best Eight Months” which ends in June. June ranks near the bottom on the Dow Jones Industrials just above September since 1950 with an average loss of 0.3%. S&P 500 performs poorly as well, ranking tenth, but essentially flat (–0.02% average).

June 2018 ...</p><a class= Continue Reading →

0

Seasonal Research May 2018: Russell 2000 & Small Caps Best Record Week before Memorial Day Weekend

Over the last 21 years, DJIA has advanced just 47.6% of the time during the week before Memorial Day weekend. Of the five major indices we frequently cite, it is the weakest averaging a 0.29% loss. S&P 500, NASDAQ and Russell 1000 are better, but average performance over the last 21 years is still just a fractional gain. Russell 2000 has the best track record, up 71.4% of the time with an average gain of 0.42%. Since 2003, Russell 2000 ...

Continue Reading →
0

Seasonal Research April 2018: April’s Option Expiration Week Historically Bullish

April option expiration is generally bullish across the board with solid gains on the last day of the week, the entire week and the week after. Since 1982, DJIA and S&P 500 have both advanced 23 times in 36 years on expiration day with an average gain of just under 0.2%. Expiration week as a whole has a slightly more bullish track record over the past 36 years to expiration day. Average weekly gains are 1% or better for S&P ...

Continue Reading →
0

Seasonal Research March 2018: First Trading Day of Q2 DJIA and S&P 500 Advance 75.0% of the Time


According to the Stock Trader’s Almanac 2018, the first trading day of April is DJIA’s second best first trading day of months based upon total points gained. Only May’s first trading day is stronger. Looking back at the last 24 years, in the tables below, we can see DJIA and S&P 500 have both advanced 75.0% of the time (up 18 of last 24) with average gains right around 0.5%. NASDAQ and Russell 2000 have slightly weaker track records and smaller ...

Continue Reading →
0

Almanac Update February 2018: Big January Gains Correct or Consolidate in February

February tends to follow the current trend, though big January gains often correct or consolidate during the month of Valentines and Presidents as Wall Street evaluates and adjusts market outlooks based on January’s performance. Since 1950, January S&P 500 gains of 2% or more corrected or consolidated in February 62.1% of the time. In the 20 years that the S&P 500 gained 4% or more in January, 65.0% of the time the S&P declined or finished flat (less than 1% ...

Continue Reading →
0
Page 4 of 4 1234