Posts Tagged '$^GSPC'

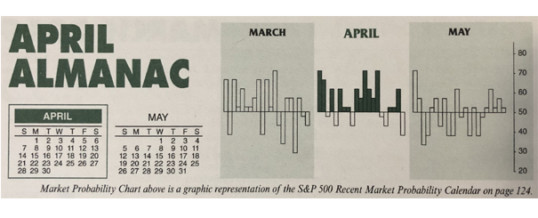
Almanac Update April 2019: Up Thirteen Years in a Row

The first trading day of April and the second quarter, has enjoyed notable strength over the past 24 years, advancing 17 times with an average gain of 0.37% in all 24 years for S&P 500. However, four of the seven declines have occurred in the last six years. Other declines were in 2001, 2002 and 2005. DJIA’s record on April’s first trading day matches the S&P 500, 17 advances in 24 years. NASDAQ recent performance is slightly weaker than DJIA ...

Continue Reading →
0

Market Outlook April 2019: End Q1 Consolidation Resolves Higher In April

April is the last month of DJIA’s and S&P 500’s “Best Six Months” of the year. As you can see in the accompanying chart of the “Pre-Election Year Seasonal Patterns” the major U.S. stock market indices have historically rallied quite sharply through April. Then DJIA in black and S&P 500 in green historically begin to move sideways at the beginning of the “Worst Six Months” (Sell in May) in May and June while NASDAQ in blue continues to run higher ...

Continue Reading →
0

Market Outlook March 2019: Rally Intact Pausing at Resistance & Seasonal Weak Spots

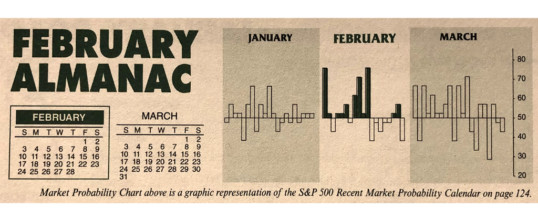
Since Christmas the market has ripped higher on supportive market internals, still solid overall fundamentals and improving technicals. In line with the Seasonal Market Probability Calendar (graphically represented on page 20 of the Stock Trader’s Almanac 2019 in the “February Almanac”) the market succumbed to usual February weakness after the first few days of the month and again around the Presidents’ Day holiday and again today on the usually bearish last trading day of the month.

As you can see in ...

Continue Reading →
0

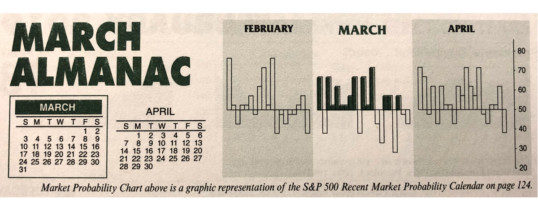
Almanac Update March 2019: Even Better in Pre-Election Years

Turbulent March markets tend to drive prices up early in the month and batter stocks at month end. Julius Caesar failed to heed the famous warning to “beware the Ides of March” but investors have been served well when they have. Stock prices have a propensity to decline, sometimes rather precipitously, during the latter days of the month. In March 2001, DJIA plunged 1469 points (-13.5%) from March 9 to the 22.

March packs a rather busy docket. It is the ...

Continue Reading →
0

Market Outlook February 2019: Market Internals Support Rally & Solid 2019 Gains

The Dow posted a 7.2% gain for the month of January – not only its best monthly gain in the past three months, but its best January since 1989. S&P 500 outpaced the Dow with a 7.9% gain for the month – its best January since 1987, scoring our third January Indicator Trifecta in a row. Further details on the bullish implications of the January Indicator Trifecta can be seen here “January Barometer 2019 Official Results.

NASDAQ stocks ...

Continue Reading →
0

Almanac Update February 2019: Generally a Tepid Month for Large Caps

Even though February is right in the middle of the Best Six Months, its long-term track record, since 1950, is not all that stellar. February ranks no better than seventh and has posted paltry average gains except for the Russell 2000. Small cap stocks, benefiting from “January Effect” carry over; tend to outpace large cap stocks in February. The Russell 2000 index of small cap stocks turns in an average gain of 1.1% in February since 1979—just the seventh best ...

Continue Reading →
0

January Barometer: Trifecta Up 3-For-3 Bullish for 2019

S&P 500 finished the month strong with a 7.9% gain. This is the best S&P January since 1987. This is also the third January Trifecta in a row. Last year the S&P 500 crumbled in the fourth quarter under the weight of triple threats from a hawkish and confusing Fed, a newly divided Congress and the U.S. trade battle with China, finishing in the red. 2017’s Trifecta was followed by a full-year gain of 19.4%, including a February-December gain of ...

Continue Reading →
0

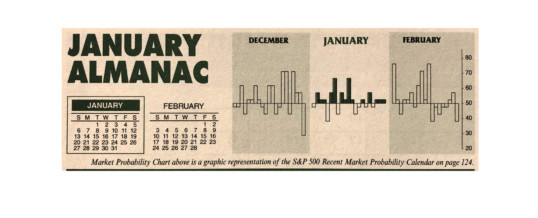
Almanac Update January 2019: Top Month for Stocks in Pre-Election Years

January has quite a legendary reputation on Wall Street as an influx of cash from yearend bonuses and annual allocations typically propels stocks higher. January ranks #1 for NASDAQ (since 1971), but sixth on the S&P 500 and DJIA since 1950. It is the end of the best three-month span and holds a full docket of indicators and seasonalities.

DJIA and S&P rankings did slip from 2000 to 2018 as both indices suffered losses in ten of those nineteen Januarys with ...

Continue Reading →
0

Market Outlook December 2018: Season of the Rally

It is the season for rallies, but not the Santa Claus Rally quite yet. As I reiterated once again earlier this week on my blog, the Santa Claus Rally is not any seasonal rally in the fourth quarter of the year or around yearend, it is the usual short, sweet, respectable rally Santa brings to Wall Street within the last five days of the year and the first two in January.

The Santa Claus Rally was discovered and named by ...

Continue Reading →
0

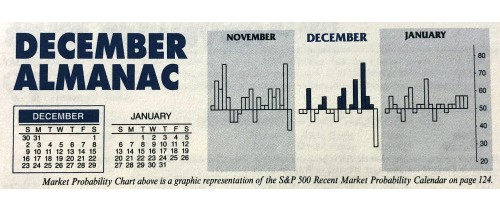
Almanac Update December 2018: Top Month Fueled by Holiday Cheer

December is the number one S&P 500 month and the second-best month on the Dow Jones Industrials since 1950, averaging gains of 1.6% and 1.7% respectively. It’s also the second best for NASDAQ (1971). Rarely does the market fall precipitously in December. When it does it is usually a turning point in the market—near a top or bottom. If the market has experienced fantastic gains leading up to December, stocks can pullback.

Trading in December is holiday inspired and fueled by ...

Continue Reading →
0
Page 2 of 4 1234