Posts Tagged 'Fed'

August 2020 Market at a Glance

Seasonal:

Neutral. August has been the worst DJIA, S&P 500 and NASDAQ month of the year since 1988. However, August’s track record in election years since 1950 (DJIA & S&P 500) or 1971 (NASDAQ) is much better. Average election year August performance ranges from 0.7% by DJIA to 3.3% for Russell 2000 (since 1979). This election year could be different since the ...

Continue Reading →
0

July 2020 Market at a Glance

Seasonal:

Neutral. July is the best month of the third quarter, but bulk of gains are in first half of month. July is historically weaker in election years. NASDAQ’s midyear rally lasts until July 14 this year. July is the first month of NASDAQ’s “Worst Four Months” and the third month of DJIA & S&P 500 “Worst Six Months.”

Continue Reading →
0

June 2020 Market at a Glance

Seasonal:

Neutral. June is the last month of NASDAQ’s “Best Eight Months.” DJIA and S&P 500 “Best Six Months” has already ended. NASDAQ’s Seasonal MACD Sell Signal can trigger as soon as the close on June 1. June has performed better in Election Years, second best S&P 500 month, #5 DJIA, #4 NASDAQ and Russell 2000.

Continue Reading →
0

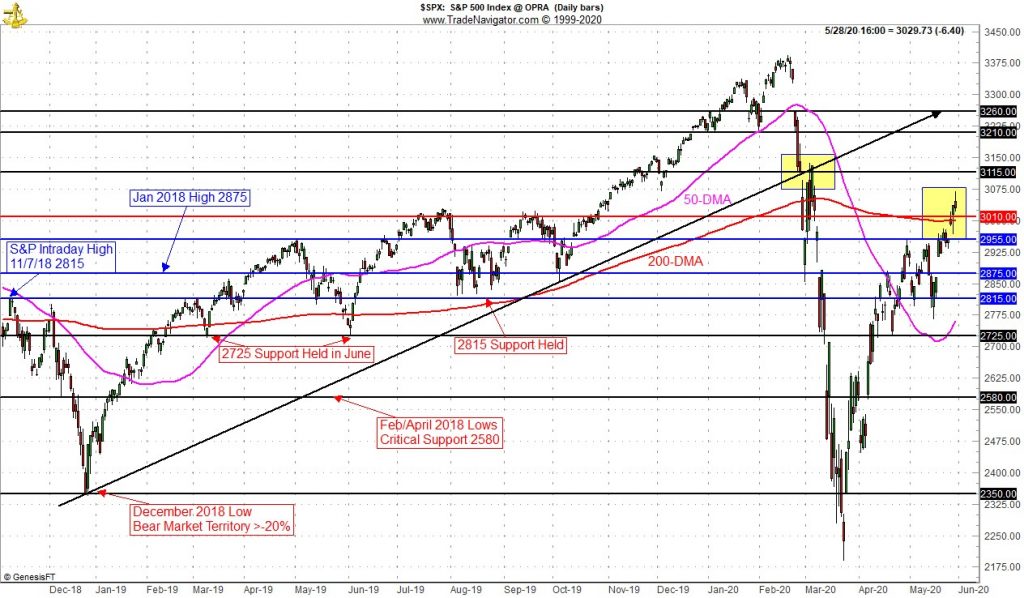
June 2020 Outlook: Rally Set to Pause at End of Best 8 Months

Our Best Six Months Seasonal MACD Sell Signal for DJIA and S&P 500 triggered on May 13 when this recovery rally took a brief pause. The rally then resumed adding to May’s gains and putting NASDAQ back in the black for the year and up 5.8% year-to-date on the close of May. But the market is bumping into some resistance here technically and looks set to pause again and pullback to recent support levels.

Continue Reading →

0

May 2020 Market at a Glance

Seasonal:

Neutral. May is the first month of DJIA and S&P 500 “Worst Six Months. Our Seasonal MACD Sell signal has not triggered yet suggesting the rally could continue in the near-term. The history of “Worst Six Months” after a bad “Best Months” is not encouraging. This year’s negative January Barometer and breached December DJIA low, point to possible ...

Continue Reading →
0

April 2020 Outlook: Beware the Bear Market Bounce

The Dow’s 6.4% rally on March 26 capped the biggest three-day surge since October 6-8, 1931. That may sound encouraging, but remember 1931 was the worst year for DJIA on record, down 52.7%. DJIA jumped 21.3% from the low on Monday March 23. This surge came on the heels of the fastest and most furious decline in stock market history. DJIA dropped 37.1% from its 2/12/2020 all-time high in 40 calendar days. It fell 35.9% in 31 days from the ...

Continue Reading →
0

April 2020 Market at a Glance

Seasonal:

Bullish. April is DJIA’s best performing month since 1950, second best for S&P and fourth best for NASDAQ (since 1971). However, April also marks the end of our “Best Six Months” for DJIA and the S&P 500. Our Seasonal MACD Sell signal can occur as early as April 1 but could easily be delayed should the market continue to recover ...

Continue Reading →
0

March 2020 Market at a Glance

Seasonal:

Bullish. Normally a decent performing market month, March is above average in election years with advances 64.7% of the time with a 1.0% average DJIA gain since 1952. S&P 500 has also advanced 64.7% of the time since 1952, but gains have been slightly better at 1.2%, on average. NASDAQ has not fared well in March in election years since ...

Continue Reading →
0

January 2020 Market at a Glance

Seasonal:

Bullish. January is the third month of the Best Six/Eight, but it is the last of the Best-Three-Consecutive-month span. January is the top month for NASDAQ (since 1971) averaging 2.7%, but it has slipped to sixth for DJIA and S&P 500 since 1950. Election-year Januarys have been weaker (DJIA -0.01%, S&P 500 +0.2% NASDAQ +1.7%). The Santa Claus Rally ends ...

Continue Reading →
0
Page 4 of 8 «...23456...»