Posts Tagged 'DJIA'

February 2022 Market at a Glance

Seasonal:

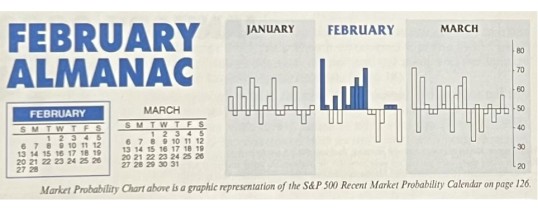
Neutral. February is part of the “Best Six Months,” but it is historically the poorest performing month of the six. February ranks #8 for DJIA, #11 S&P 500 and #10 for NASDAQ. Russell 2000 tends to outperform in February most likely due to carry over of the January Effect. Midterm Februarys have historically been better, but still only mid-pack for DJIA ...

Continue Reading →
0

February 2022 Outlook: Heightened Volatility Expected to Continue Through Midterm Elections

In our 2022 Annual Forecast last month we were candid about our less than sanguine outlook for 2022 and that we were expecting a reversion to the mean in annual returns and a decent correction. We shared the many obstacles and hurdles we felt the market would be facing in 2022. First and foremost are the forces of the 4-Year Cycle and the impact the midterm elections have on the market.

Midterm election years are notoriously volatile as the two political ...

Continue Reading →
0

Almanac Update February 2022: Historical Performance Improves in Midterm Years

Even though February is right in the middle of the Best Six Months, its long-term track record, since 1950, is rather tepid. February ranks no better than sixth and has posted meager average gains except for the Russell 2000. Small cap stocks, benefiting from “January Effect” carry over; historically tend to outpace large cap stocks in February. The Russell 2000 index of small cap stocks turns in an average gain of 1.1% in February since 1979—just the sixth best month ...

Continue Reading →
0

Almanac Update January 2022: Indicator Trifecta Could Reshape 2022

January has quite a reputation on Wall Street as an influx of cash from yearend bonuses and annual allocations has historically propelled stocks higher. January ranks #1 for NASDAQ (since 1971), but fifth on the S&P 500 and DJIA since 1950. January is the last month of the best three-month span and holds a full docket of indicators and seasonalities.

DJIA and S&P rankings did slip from 2000 to 2016 as both indices suffered losses in ten of those seventeen Januarys ...

Continue Reading →
0

2022 Forecast: Early Year High, Worst Six Months Correction & Q4 Rally

As we laid out in our 2021 Forecast Best Case scenario last year Covid-19 vaccines rolled out rather well in 2021 allowing lockdowns and most restrictions to be removed. Additional fiscal stimulus and an extremely accommodative Fed kept the economy humming and the market rallying. Unemployment dove from the early pandemic peak rather precipitously. Leisure, hospitality and travel did not surge per se, but they sure did rebound. The market is on pace to deliver our Best ...

Continue Reading →
0

January 2022 Market at a Glance

Seasonal:

Bullish. January is the fifth best month for DJIA and S&P 500 since 1950. #1 NASDAQ month since 1971. However, since 2000, January has been notably weaker and in Midterm years average performance for DJIA and S&P 500 turns negative. Santa Claus Rally ends on January 4, First Five Days concludes on January 7 and lastly the January Barometer at ...

Continue Reading →
0

Almanac Update December 2021: Small Cap Effect & Santa Claus Rally

December is the number three S&P 500 and Dow Jones Industrials month since 1950, averaging gains of 1.5% on each index. It’s the second-best Russell 2000 (1979) month and third best for NASDAQ (1971). In 2018, DJIA suffered its worst December performance since 1931 and its fourth worst December going all the way back to 1901. However, the market rarely falls precipitously in December and a repeat of 2018 is not all that likely. When December is down it is ...

Continue Reading →
0

December 2021 Outlook: New Highs Likely Before Yearend

Seasonal patterns continue to reassert themselves and that is positive for the probability of new highs by yearend. Typical September and early October weakness created a solid set up for our October 8 Seasonal MACD Buy Signal. Then late-October seasonal strength carried into early November before the usual pre-Thanksgiving weakness ensued. As we head into December, the market is trying to find its footing and we look for the market to shake off its current funk as it usually does ...

Continue Reading →
0

December 2021 Market at a Glance

Seasonal:

Bullish. December is the #3 month for DJIA, S&P 500 and NASDAQ. It is also the second month of the “Best Months” and best three consecutive month span. Performance is modestly softer in post-election years. Santa Claus Rally begins on the open on December 27 and runs until the close on the second trading day in January.

Continue Reading →
0

Almanac Update November 2021: Best Consecutive Three-Month Span Begins

November maintains its status among the top performing months as fourth-quarter cash inflows from institutions drive November to lead the best consecutive three-month span November-January. However, the month has taken hits during bear markets and November 2000, down –22.9% (undecided election and a nascent bear), was NASDAQ’s second worst month on record—only October 1987 was worse.

November begins the “Best Six Months” for the DJIA and S&P 500, and the “Best Eight Months” for NASDAQ. Small caps come into favor during ...

Continue Reading →
0
Page 4 of 19 «...23456...»