
Aloha friends. We’ve seen a lot these past two weeks in Hawaii from snorkeling with sea turtles and swimming in waterfalls on Maui to the southernmost point in the U.S. and Kilauea Caldera on the Big Island, then to surfing Hanalei Bay and hiking the Na Pali Coast in Kauai and now Waikiki Beach on Oahu for the last leg of the trip. We will be heading to Pearl Harbor National Memorial and Banzai Pipeline before heading home. We joke each time we jump to a new island that this is our favorite island so far.
Economically the islands are booming again despite the governor’s recent call for tourists not to visit the islands right now and restaurants at 50% capacity. Rental cars are rather scarce and super-high priced. The Islands are bustling, though you can still see the economy being held back by the pandemic fears and protocols, but the Aloha Spirit prevails.
As the summer travel season winds down here in Hawaii as well as on the Mainland and the rest of the world the market faces seasonal challenges as the third quarter comes to a close in the September, which is still the worst month of the year. The market is also struggling technically on the charts and has been exhibiting weak market internals.
Some geopolitical hotspots have flared up, namely our old nemesis Afghanistan, as well as persistent troubles in the Middle East, the Far East and with Russia. Add in fears of the Delta variant fourth wave of Covid-19 and Fed taper chatter and the potential for a September selloff or at least pause in the march to continued new highs increases. But until the fiscal spending spigot flow rate is reduced and the Fed telegraphs it will begin to tighten the market is likely to wander higher on stimulus and easy money.
As you can see in the updated chart here of the S&P 500 One-Year Seasonal Pattern Since 1949, the market has so far defied the typical seasonal summer weakness it normally exhibits. The market continues to rally on pent up demand from pandemic restrictions as well as trillions in federal fiscal stimulus and continued quantitative easing and still historically low interest rates from the Federal Reserve.
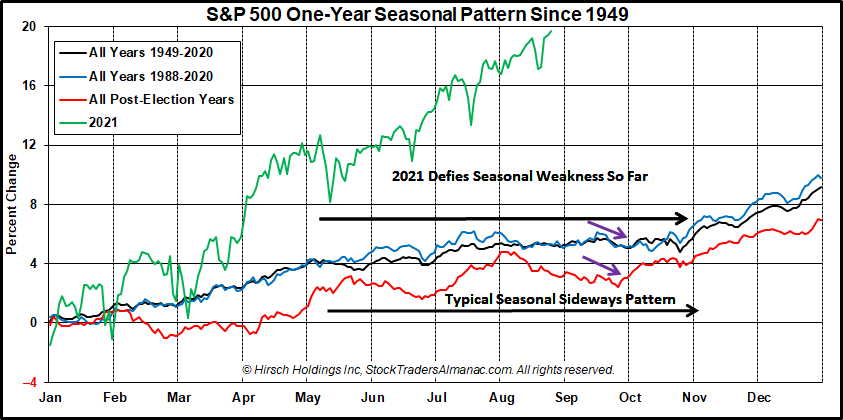
If the market continues to defy gravity and rallies through Labor Day, the next most likely weak spot is the end of September after Triple Witching on the third Friday of September as noted by the two purple arrows in the chart. We are not expecting any major sell off here. At most we’d expect a 5% correction or so as the market succumbs to some of the same headwinds we have been experiencing all year.
Sentiment remains elevated though bullish advisors have diminished some with a few more bears and the weekly put/call ratio has up ticked. Valuations remain elevated as earnings growth has likely peaked and the easy comps to last year’s pandemic lows fade away. Market breadth is not too fresh with a dearth of new highs and expanding new lows as the indices have logged new highs. Weekly advancing stocks versus declining stocks have been mixed as well.
We continue to expect the market to wander higher with the potential for a pause or sell off highest toward the end of September. Any late-September/October sell off would set up the next Best Months Seasonal MACD Buy Signal quite well and we still expect the S&P 500 to finish the year in the 4500-4600 range or even higher.
AUG
2021