

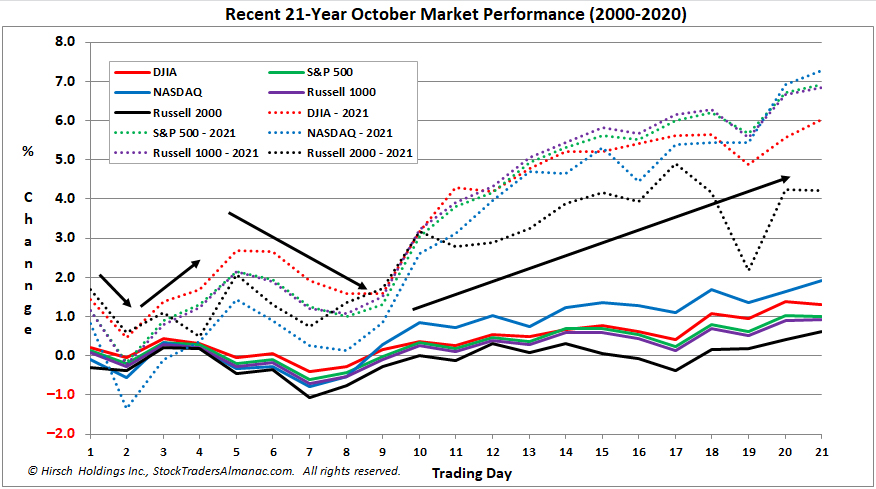
It looks as though the market has resisted Octoberphobia and averted the feared crashes or massacres that have given the month its bad reputation. More significantly for us though is the continuation of the return to normal seasonal patterns we began to see last month that had been off kilter through much of the pandemic. As you can see in the chart of the typical October pattern over the recent 21-year period stocks have tracked the seasonal pattern rather closely this month, but with above average gains ranging from 4.2% for Russell 2000 to 7.3% for NASDAQ.
November leads the strongest seasonal period for stocks, kicking off the best consecutive 3-months, the Best Six Months for DJIA and S&P 500 and the Best Eight Months for NASDAQ. It benefits from “Fourth Quarter Market Magic” as detailed on page 102 of the 2021 Almanac. Trading around Thanksgiving has been lifted by the holiday spirit for many years, but we believe the best short-term trading strategy in recent years has been to come into the week long and exit into strength on the shortened trading day the Friday after.
Since Stock Trader’s Almanac issued its “Best Months Seasonal MACD Buy Signal” on October 8 the market has done quite well with DJIA up 3.1%, S&P 500 up 4.9% and NASDAQ up 6.3% as of the close on October 29. This is already a good chunk of the typical Best Months with MACD timing historical average gains of 8.9% for DJIA and 13.4% for NASDAQ. We do not expect the blowout performance we had last year during the Best Months with DJIA up 19.1% and NASDAQ up 18.3%.
This is in keeping with our expectation for a reversion to the mean for overall market returns. Back in March on the one-year anniversary of the pandemic low when the S&P was up 75% for the rolling 1-year period we ran the numbers on the 1-year rolling returns for the S&P 500 back to 1949. While these giant spikes do come at the early stages of extended bull runs, gains of this magnitude have not been sustained and the market has tended to revert to the mean. The arithmetic mean or average rolling 1-year return since 1949 is 9.4%, which isn’t bad either.
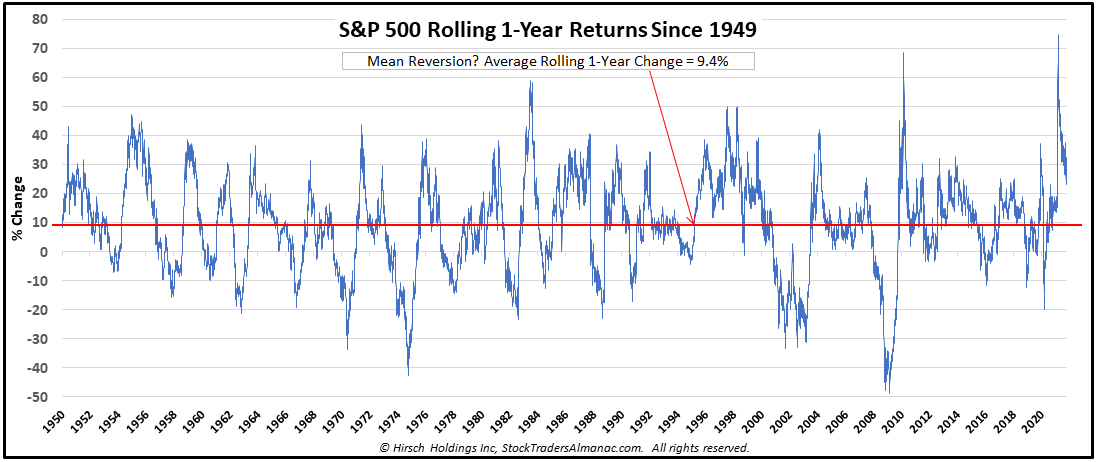
As you can see in the chart the market is already heading quickly toward that mean. So we expect modest gains over the next several months in keeping with historical seasonal patterns. If we tack on a 1% gain on average each month over the next six-eight months that will be in keeping with the mean reversion to average rolling 1-year returns and overall historical market performance.
We expect the positive support from seasonal forces, solid corporate earnings, improving market internals and technical momentum to outweigh negative inputs from nagging transitory inflation, supply chain bottlenecks, the flattening yield curve and decelerating growth for the time being.
So we are bullish through yearend and into Q1 of 2022 when optics from midterm election campaigning and mudslinging are likely to make the market more susceptible to the headwinds it’s been able to stave off with support from easy money from the Federal Reserve and free money from the Federal Government. For now enjoy the yearend rally and Best Months of the year.
NOV
2021