

The Worst Six Months of the year (May-October) for 2022 commences on the heels of the worst start for the market since 1950. At the end of April, S&P 500 was down 13.3% for the year. The second worst start to the year was 1970, down 11.4% – more on 1970 in a moment. As of the close on April 29, April is down 4.9% for DJIA, 8.8% for S&P 500 and 13.3% for NASDAQ. April being the best month of the year this is not a great sign.
As we noted on the blog, when the S&P 500 is down year-to-date and down in April, it preceded a yearly loss 69.2% of the time with an average loss of 7.3%. April has not lived up to its historically bullish reputation this year. S&P 500’s 8.8% decline in April is the second worst April since 1950 and fourth worst since 1930 behind 1932, 1931, and 1970.
To top off the ominous seasonality readings, the current Best Six Months from the close of October are off 7.9% for DJIA and -10.3% for S&P 500. From our MACD Buy Signal on October 8 to our recent Sell Signal on April 7 the results improve to -0.5% for DJIA and positive 2.5% for S&P. NASDAQ’s Best 8 Months ends in June but so far, it’s down 20.4% from the end of October and –15.4% from the Buy Signal.
In the words of the late, great market analyst Edson Gould (Findings & Forecasts, 1902-1987): “If the market does not rally, as it should during bullish seasonal periods, it is a sign that other forces are stronger and that when the seasonal period ends those forces will really have their say.”
Welcome To the Weak Spot of the 4-Year Cycle
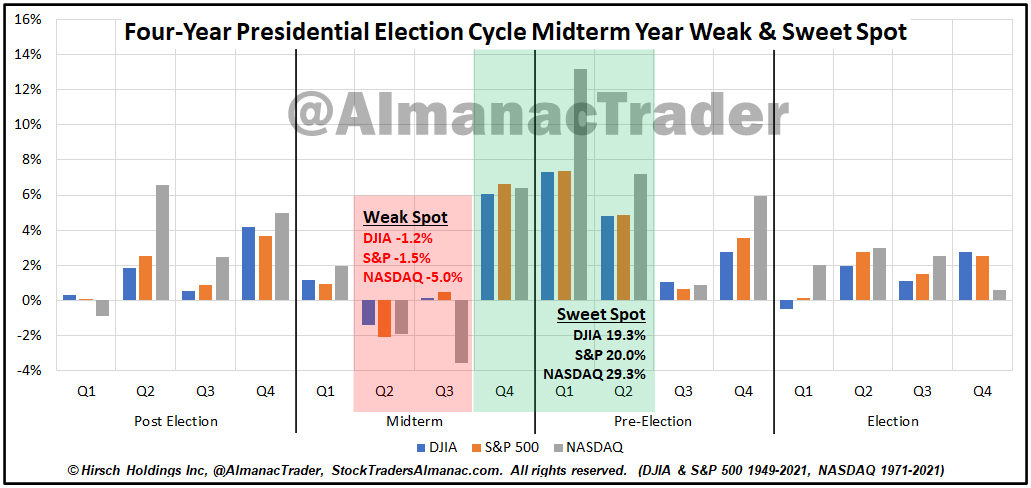
Not only are we on the cusp of the Worst Six Months, we also entered the Weak Spot of the 4-Year Presidential Election Cycle. We created the bar chart here to highlight this critical juncture of the 4-Year Cycle we have been discussing all year. The second and third quarter of the midterm year has been the weakest period of the entire 4-year pattern averaging losses over the 2-quarter period of -1.2% DJIA, -1.5% S&P and -5.0% NASDAQ. But thankfully, this sets up the even more important Sweet Spot of the cycle where DJIA gains 19.3%, S&P 20.0% and NASDAQ 29.3% over the three quarters from midterm year Q4 to pre-election year Q2.
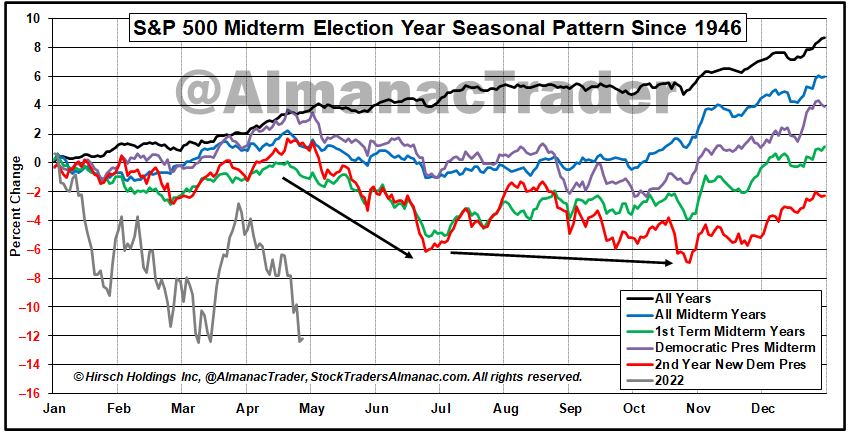
Our updated S&P 500 Midterm Year Seasonal Pattern reinforces this quadrennial buying opportunity as the market tends to find a midterm bottom over the next six months. The graph shows the “average” year, but it is important to note that these midterm bottoms have occurred at different times in individual midterm years and many of them came toward the beginning of the Weak Spot. The May 26, 1970 bear market low is a prime example.
1960, 1970 & 2022
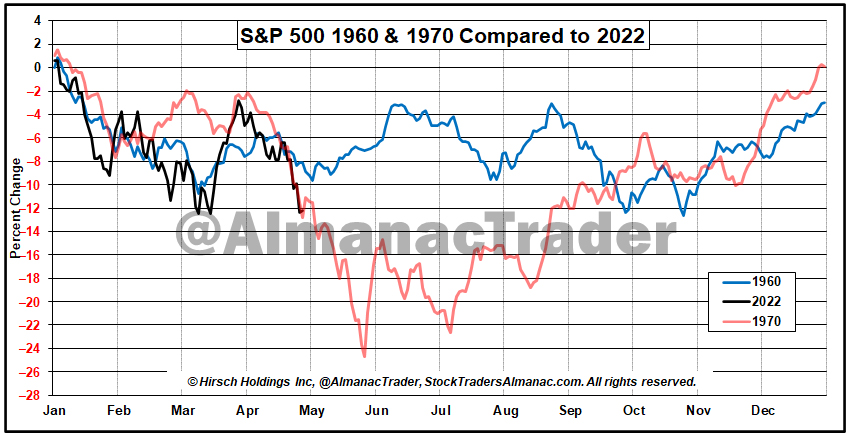
As you can see here in our graphic comparison of the years 1960 and 1970 to this year, 2022 is tracking eerily close to those two bear market years. Both 1960 and 1970 hosted recessions and rate increases in the prior year. Inflation in 1970 was closer to current conditions with the CPI (Consumer Price Index) peaking around 6.5% year-over-year. We believe it would be nice if 2022 played out more like 1960 with milder losses. Unfortunately, present circumstances are more akin to 1970. 1960 was also an election year, while1970 was a midterm year like 2022.
This time appears a little different due to covid-disrupted supply chains and the fallout from Russia’s invasion of Ukraine with soaring energy and commodity prices. We are not implying the 36% bear market losses from the 1968 top to the 1970 bottom are in the cards, but we suspect that we have not found bottom just yet. Though it is becoming increasingly possible we get a bottom sooner rather than later as we did in May 1970 with the Fed expected to raise rates 50 basis points at the May meeting and Russia looking to chalk up a victory on WWII Victory Day celebrated on May 9 in Russia.
The support we have been keen on for the last two months at the intraday lows on February 24, the day Russia invaded Ukraine have held on DJIA and S&P 500 but are being tested on NASDAQ and our favorite benchmark these days NASDAQ 100 Index (NDX), which is tracked by the Invesco QQQ Trust (QQQ). NDX has been leading the market in both directions for several years.
After failing to find support at the 200- and 50-day moving averages in March and April NDX closed below the February 24 and March 14 intraday and closing lows two days in a row on April 26 and 27. Then on April 29 it closed just below the big round 13000 number. We believe a breach of this level would likely signal a test of the March 2021 lows around 12250. This would be equivalent to about 31000 DJIA and 3750 S&P 500. The NASDAQ Composite has already tested and slightly breached the March 2021 support levels around 12500, which brings the old October 2020 support levels around 10500 into play.
In short, the market currently faces a plethora of headwinds. Preliminary readings for 2022 Q1 GDP (Gross Domestic Product) were a major disappointment registering a 1.4% loss versus expectations of a 1% increase. It was a complicated report with big inflation numbers and a large trade deficit that likely subtracted about 3 percentage points from the GDP number. By the time the final Q1 GDP number comes in June, we suspect it is likely to be revised higher.
We might get an early midterm bottom like 1970 or a milder more drawn-out bottoming process like 1960 and the average midterm year. Either way, fasten your seatbelts, we believe volatility is probably here for the next several months as the market searches for bottom. Gains on May’s first trading day are encouraging, but let’s not get ahead of ourselves as we expect continued heightened volatility in the face of midterm year and seasonal pressures, supply chain issues, inflation, and rate hikes.
MAY
2022