

Holiday inspired trading before the Good Friday holiday market closing helped trim losses for the month of March and Q1 2018. NASDAQ Composite’s 2.3% gain for the first quarter of 2018 was a bright spot. So while there is much negativity on the news and in market action this year, I wanted to point out some positives and encourage patience through what promises to be a tumultuous ride over the next several months as the market and economy search for support for the next leg higher.
The volatility this March was actually not all that unusual. Last month we summoned the famous warning Julius Caesar failed to heed as a reminder to beware The Ides of March. As it did this year the market tends to come into March strong, but then after mid-month is prone to weakness and big end-of-Q1 hits. Most of the damage occurred the week after the Ides, which is also the week after March Triple Witching (when stock options, index options and index futures contracts all expire on the third Friday) as it does most years.
Much like the weather surrounding the vernal equinox, March market action has been rather volatile and turbulent in recent years with wild fluctuations and large gains and losses. This is precisely what we witnessed in 2018.
This is also typical midterm election year market behavior. In fact, the timing of President Trump’s policy successes and more unsettling agenda initiatives like the tariff and trade machinations have been similar to the timing of a democratic president, who usually don’t ramp up their less savory policy pushes until the midterm year. This is what generally makes post-election years worse for republicans and midterm years worse for democrats. The policies are not “democratic” in nature, but the timing is and this is setting up a typically more pronounced midterm year Worst Six Months (May-October) for 2018 as illustrated in the graph of “S&P 500 4-Year Cycle Seasonal Patterns Since 1949.”
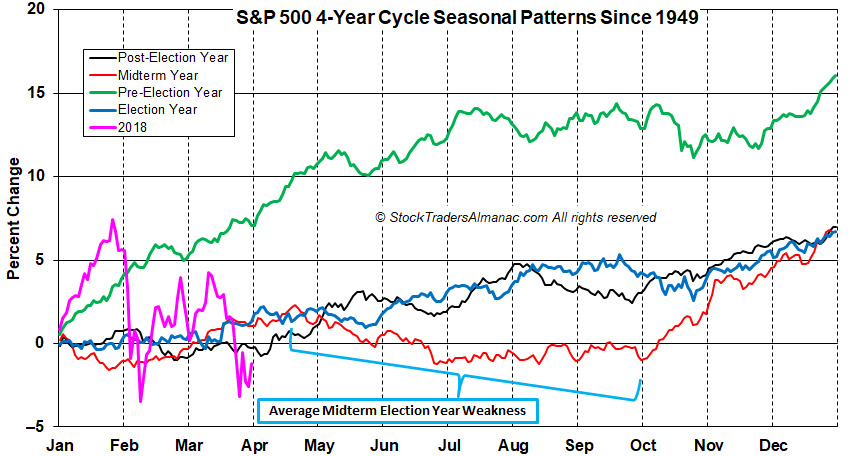
Midterm Aprils are historically a bit softer, but since we’ve come down so much ahead of April, we expect a bit of a respite this April. Then we expect the weakest two quarters of the 4-year cycle and the worst six months to suffer from sideways action at a minimum to a slightly deeper correction that finds bottom in Q2-Q3. Since 1949 the second and third quarters of midterm years have averaged losses of -1.8% for DJIA, -2.2% for S&P 500 and -6.7% since 1971 for NASDAQ. And remember since 1961, 9 of the last 17 bear markets bottomed in the midterm year.
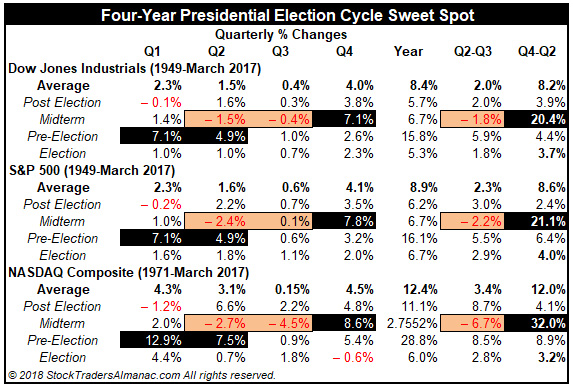
But this would be a textbook set up for the sweet spot of the 4-year cycle and the “Midterm Year Bottom Picker’s Paradise.” The “sweet spot” of the 4-year cycle is the 3-quarter span from Q4 midterm year to Q2 pre-election year. Since 1949, market gains from the fourth quarter of midterm year to the second quarter of the pre-election year have averaged +20.4% for DJIA, +21.1% for S&P 500 and +32.0% since 1971 for NASDAQ. Also the gain from the midterm low to pre-election year high has averaged +47.4 since 1914 for DJIA and +70.2% NASDAQ since 1971.
So while we are less sanguine after April for the worst six months, our Base Case Annual Forecast scenario is still on track for above average midterm year gains in the range of 8-15%, with a mild worst six months correction or pullback. This is further supported by the Positive January Indicator Trifecta we registered with the Santa Claus Rally, the First Five Days and the full-month January Barometer all up this year.
We will be looking at first quarter corporate earnings announcements in April to shed some light on the health and growth prospects of corporate America and companies around the world and the 30-Year Treasury Bond for signs of overall economic strength as the recent softness in 30-Year Treasury yields was driven by a cooling of growth and inflation expectations. On the risk side, we will be keeping an eye out for more state tax increases like what’s going on in Utah and a technical breakdown in all the major averages below the February lows for signs of weakness. So far we have once again found support around the 200-day moving averages.
APR
2018