
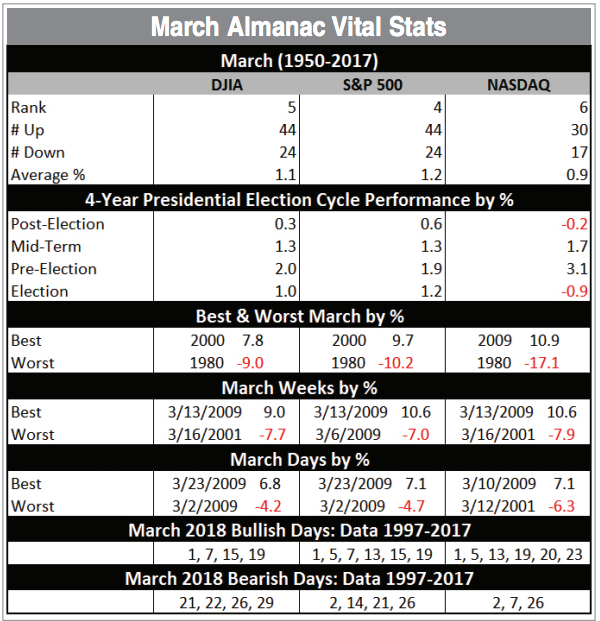
Tempestuous March markets tend to drive prices up early in the month and batter stocks at month end. Julius Caesar failed to heed the famous warning to “beware the Ides of March” but investors have been served well when they have. Historically, stock prices have often declined, sometimes rather precipitously, during the latter days of the month. March packs a rather busy docket. It is the end of the first quarter, which brings with it quarterly options expiration and an abundance of portfolio maneuvers from The Street. March quarterly options expiration weeks have been quite bullish in recent years. But the week after is the exact opposite, DJIA down 20 of the last 30 years — and frequently down sharply for an average drop of 0.54%. Notable gains during the week after for DJIA of 4.9% in 2000, 3.1% in 2007, 6.8% in 2009, and 3.1% in 2011 are the rare exceptions to this historically poor performing timeframe.
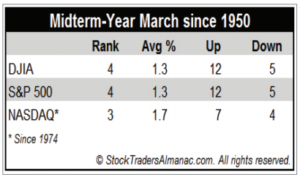
Normally a solid performing market month, March has improved modestly in midterm-election years (see Vital Statistics table below). In midterm years March ranks: 4th best for DJIA and S&P 500 and 3rd best for NASDAQ. DJIA and S&P 500 have been up for five straight midterm Marchs.
Saint Patrick’s Day is March’s sole recurring cultural event. Gains the day before Saint Patrick’s Day have proved to be greater than the day itself and the day after. Perhaps it’s the anticipation of the patron saint’s holiday that boosts the market and the distraction from the parade down Fifth Avenue that causes equity markets to languish. Or maybe it’s the fact that Saint Pat’s usually falls in quarterly options expiration week. With the holiday falling on a Saturday this year (but also the day after quarterly options expiration), the day before could be weaker than usual as some traders may look to stretch the holiday into a three-day weekend.
Whatever the case, since 1950, the S&P 500 has posted an average gain of 0.21% on Saint Patrick’s Day (or the next trading day when it falls on a weekend), a gain of 0.13% the day after, but the day before averages a 0.24% advance.
On the day before Good Friday S&P 500 has logged gains averaging 0.65% in the last 20 years, up 15 times, down 5 times. NASDAQ has averaged gains of 0.78% the day before Good Friday in the last 20 years, up 18 times, down 2 times. Trading the day after Easter has been weak.
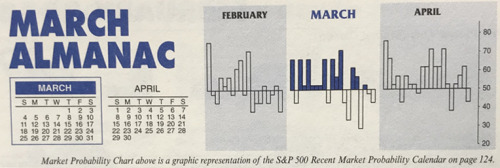
MAR
2018