

Climbing COVID cases and confusion about reopening the economy continues to confound the market. Even though hard working people and prudent businesses around the country are working diligently to reopen and safely serve clients and customers the increase in positive tests and hospitalization nationally is hard for the market to ignore.
Waiters are reminding diners to done their masks when ordering. Folks are waiting for the next elevator and not crowding in and business have hand sanitizer at the ready for all patrons. But many states are now pausing or reversing their reopening plan and new case rates and hospitalizations are rising to record levels in at least 16 states.
Nevertheless, the spread and uncertainty continue to make the market vulnerable to negative developments on the pandemic, economic and geopolitical fronts. Valuations are high. Technical chart resistance has become more prevalent and the incumbent president and party are on the ropes against the virus and civic unrest.
Our NASDAQ Best Eight Months Seasonal MACD Sell Signal triggered on June 11, so we are in full “Worst Four Months” defensive mode. But there are still a few seasonal bright spots in July. July is the best month of the third quarter though most of July’s gains usually occur in the first half and then we have the August/September disaster area where the market is often weak as folks are preoccupied with outdoor activities in August and end-of-Q3 portfolio restructuring in September.
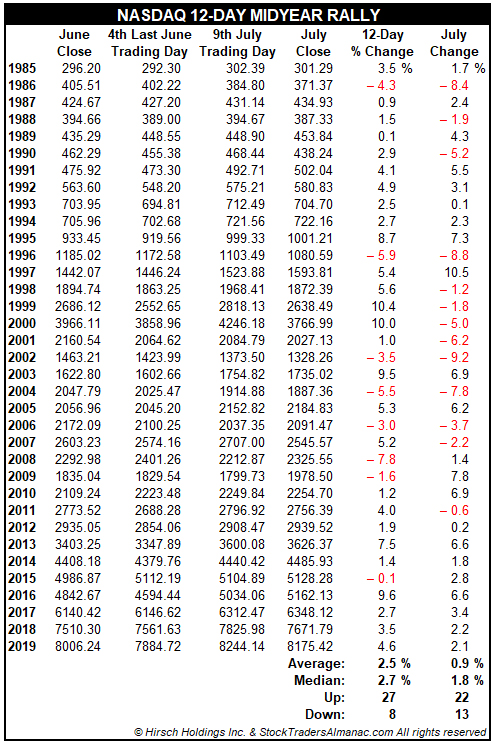
NASDAQ’s mid-year rally over the 12-day period starting with the last three trading days of June through the ninth trading day of July, what we affectionately refer to as “Christmas in July,” has been up 27 of the last 35 years and the past nine out of ten years with an average gain over the 35-year stretch of 2.5% vs. 0.9% for the month of July as a whole.
After the mid-year rally we are concerned that recent market resistance will become formidable again and support will be tested. Early in June S&P 500 stalled at our 3210 level, which is just below the intraday low on January 31 when we had the first major COVID scare selloff and the gap-down day on February 24. Then we found support near our 2955 level associated with several touch points and is just below the pink 50-day moving average.
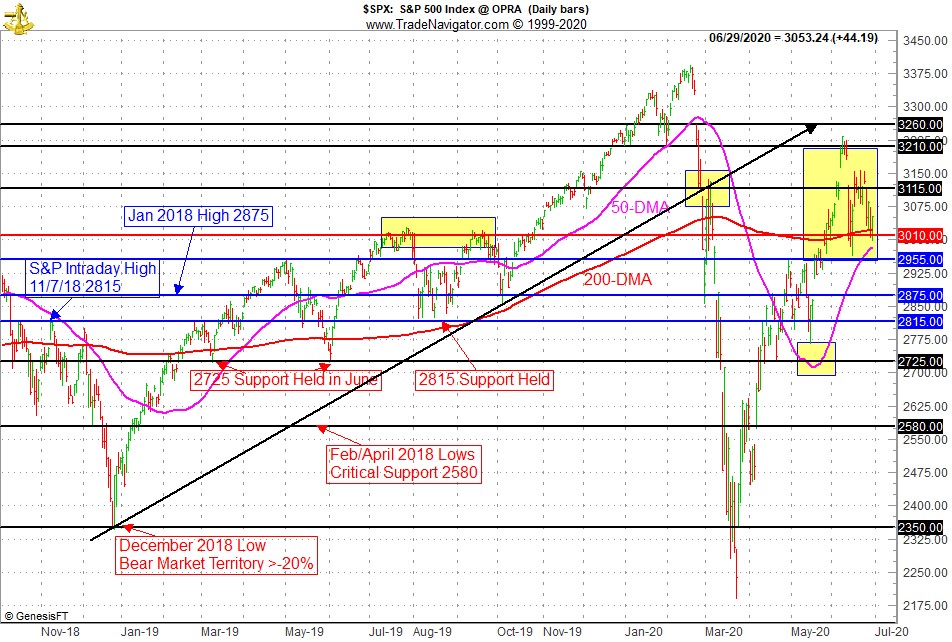
S&P 3010 is an important level at the July and September 2019 highs. 3010 is also just below the 200-day moving average. 3115 is where the big waterfall decline broke below the long uptrend line from the December 2018 low. A range in the 2955-3210 seems to be materializing, but 3115 is still putting up resistance with 3010 serving as short term support at the moment. If 2955 does not hold as support, the next major support level is 2725 where the 50-day moving average turned higher back in May.
On the Election Cycle front things are still concerning. While the market has historically performed better when a sitting president is running for reelection, this year may be flashing an incumbent party defeat warning, which does not bode well for the next few months or the year as a whole.
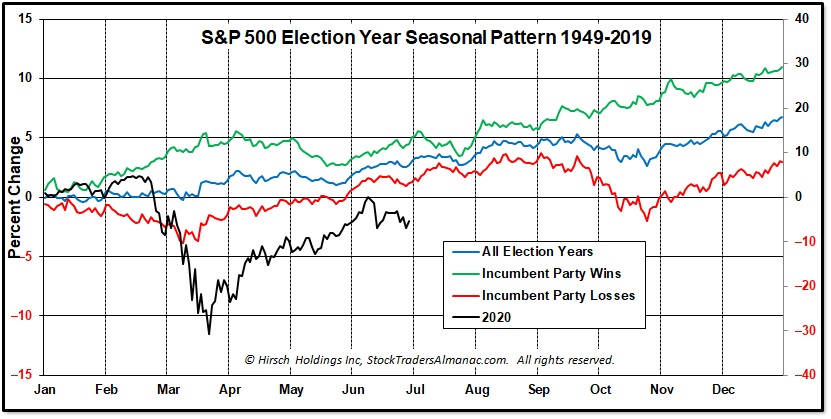
In the chart here we have plotted the one-year seasonal chart patterns for the S&P 500 during election years for 1949-2019 overlaid with 2020 year-to-date performance. Due to the magnitude of 2020’s bear market decline we have plotted it on the right scale in order to illustrate the trend comparison to election years during the 1949-2019-period versus incumbent party wins and losses. As you can see 2020 is tracking the trend of the red incumbent party losses line more closely.
We will also be keeping an eye on our good friend Sam Stovall’s, Chief Investment Strategist at CFRA, rather reliable “Presidential Predictor” indicator (see page 26 of the 2020 Almanac). When the S&P 500 is up from July 31 to October 31 during presidential election years the incumbent party retains power 11 of the 13 election years or 85% of the time since 1936. Losses for the S&P 500 over this 3-month span, just before the election, have seen a shift in party control in 7 of the 8 years for an 88% success rate.
Even if the market signals a possible incumbent defeat by declining from August through the end of October it is still likely to rally to yearend. For now, remain patient and cautious as the market works its way through the “Worst Four Months” and the summer doldrums.
JUL
2020