Almanac Update

Almanac Update October 2018: Best Month of Midterm Year

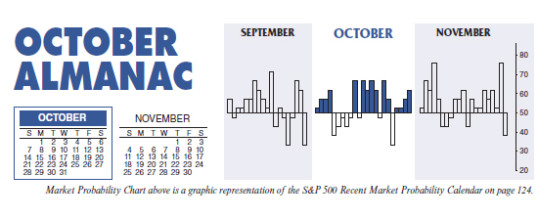
October often evokes fear on Wall Street as memories are stirred of crashes in 1929, 1987, the 554-point drop on October 27, 1997, back-to-back massacres in 1978 and 1979, Friday the 13th in 1989 and the 733-point drop on October 15, 2008. During the week ending October 10, 2008, Dow lost 1,874.19 points (18.2%), the worst weekly decline in our database going back to 1901, in point and percentage terms. The term “Octoberphobia” has been used to describe the phenomenon ...

Continue Reading →
0

Almanac Update September 2018: Midterm Elections Further Quell Returns

Since 1950, September is the worst performing month of the year for DJIA, S&P 500 and NASDAQ (since 1971). September was creamed four years straight from 1999-2002 after four solid years from 1995-1998 during the dot.com bubble madness. Although September’s overall rank improves modestly in midterm years going back to 1950, average losses widen for DJIA (–1.0%) and NASDAQ (–0.8%). S&P 500’s average September loss improves slightly from –0.5% to –0.4% in midterm years. Although September 2002 does influence the ...

Continue Reading →
0

Almanac Update August 2018: Worst Month of the Year

Money flows from harvesting made August a great stock market month in the first half of the Twentieth Century. August was the best month from 1901 to 1951. In 1900, 37.5% of the population was farming. Now that less than 2% farm, August is amongst the worst months of the year. It is the worst DJIA and S&P 500 month since 1987 with average declines of 1.0% and 0.8% respectively. August is also the worst month for NASDAQ (–0.1%) over ...

Continue Reading →
0

Almanac Update July 2018: Best Month of Q3, But NASDAQ Struggles

July historically is the best performing month of the third quarter however, the mostly negative results in August and September make the comparison easy. Two “hot” Julys in 2009 and 2010 where DJIA and S&P 500 both gained greater than 6% and a strong performance in 2013 have boosted July’s average gains since 1950 to 1.2% and 1.0% respectively. Such strength inevitability stirs talk of a “summer rally”, but beware the hype, as it has historically been the weakest rally ...

Continue Reading →
0

Almanac Update June 2018: Worst Month in Midterm Years

June has shone brighter on NASDAQ stocks over the last 47 years as a rule ranking ninth with a 0.6% average gain, up 25 of 47 years. This contributes to NASDAQ’s “Best Eight Months” which ends in June. June ranks near the bottom on the Dow Jones Industrials just above September since 1950 with an average loss of 0.3%. S&P 500 performs poorly as well, ranking tenth, but essentially flat (–0.02% average).

June 2018 ...</p><a class= Continue Reading →

0

Almanac Update May 2018: Start of “Worst Six Months” for DJIA and S&P 500

May officially marks the beginning of the “Worst Six Months” for the DJIA and S&P. To wit: “Sell in May and go away.” May has been a tricky month over the years, a well-deserved reputation following the May 6, 2010 “flash crash”. It used to be part of the “May/June disaster area.” From 1965 to 1984 the S&P 500 was down during May fifteen out of twenty times. Then from 1985 through 1997 May was the best month, gaining ground ...

Continue Reading →
0

Almanac Update April 2018: Up Twelve Straight, But Weaker in Midterm Years

The first trading day of April and the second quarter, has enjoyed exceptional strength over the past 23 years, advancing 17 times with an average gain of 0.49% in all 23 years for S&P 500. Declines occurred in 2001, 2002, 2005, 2013, 2015 and 2017. The worst, or largest decline, was 1.25% in 2001. This year, April 2 is also the day after Easter which has been the S&P 500’s worst post-holiday trading session. From 1984 to 2003, S&P 500 ...

Continue Reading →
0

Almanac Update March 2018: Above Average in Midterm Years

Tempestuous March markets tend to drive prices up early in the month and batter stocks at month end. Julius Caesar failed to heed the famous warning to “beware the Ides of March” but investors have been served well when they have. Historically, stock prices have often declined, sometimes rather precipitously, during the latter days of the month. March packs a rather busy docket. It is the end of the first quarter, which brings with it quarterly options expiration and an ...

Continue Reading →
0

Almanac Update February 2018: Big January Gains Correct or Consolidate in February

February tends to follow the current trend, though big January gains often correct or consolidate during the month of Valentines and Presidents as Wall Street evaluates and adjusts market outlooks based on January’s performance. Since 1950, January S&P 500 gains of 2% or more corrected or consolidated in February 62.1% of the time. In the 20 years that the S&P 500 gained 4% or more in January, 65.0% of the time the S&P declined or finished flat (less than 1% ...

Continue Reading →
0

Almanac Update January 2018: Results from Trio of Indicators Could Reshape 2018

January has quite a legendary reputation on Wall Street as an influx of cash from yearend bonuses and annual allocations typically propels stocks higher. January ranks #1 for NASDAQ (since 1971), but sixth on the S&P 500 and DJIA since 1950. It is the end of the best three-month span and possesses a full docket of indicators and seasonalities.

In midterm years, January ranks near the bottom since 1950. Large-caps have been the worst with S&P 500 and Russell 1000 ranking ...

Continue Reading →
0
Page 6 of 6 «...23456