Author Archive

Hot July Market Blazes Past Historical Performance

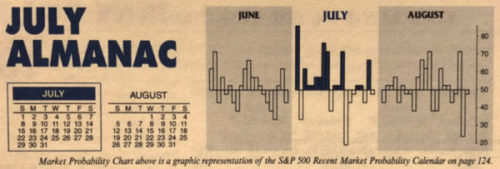
As of today’s close DJIA is up 3.18% thus far in July. S&P 500 is slightly better at 3.26% while Russell 2000 is up 3.37%. NASDAQ is best up 4.41% with another six trading sessions to go in the month. As you can see in the chart below this is well above average historical July performance at this point of the month over the last 21 years. Early month strength (trading days three, four and five) was substantially greater this ...

Continue Reading →
0

July 2018 Market at a Glance

Seasonal:

Bearish. July historically is the best performing month of the third quarter however, the mostly negative results in August and September make the comparison easy. July begins NASDAQ’s worst four months and is the third weakest performing NASDAQ month since 1971, posting a 0.4% average gain. Midterm-year July rankings are something of a mixed bag, ranking #5 for DJIA and #6 ...

Continue Reading →
0

Almanac Update July 2018: Best Month of Q3, But NASDAQ Struggles

July historically is the best performing month of the third quarter however, the mostly negative results in August and September make the comparison easy. Two “hot” Julys in 2009 and 2010 where DJIA and S&P 500 both gained greater than 6% and a strong performance in 2013 have boosted July’s average gains since 1950 to 1.2% and 1.0% respectively. Such strength inevitability stirs talk of a “summer rally”, but beware the hype, as it has historically been the weakest rally ...

Continue Reading →
0

Market Outlook July 2018: June Swoon Indicates Time to Take More Risk Off For Summer

So far our June 21 NASDAQ Best 8 Months Sell Signal has turned out to be rather timely. From our November 28 Buy Signal to our June 21 Sell Signal NASDAQ gained 11.6%. NASDAQ has given back sizeable ground since June 21. The Dow and S&P 500 have been in selloff mode a bit longer since June 13.

We have been getting on the defensive since our May 2 Dow and S&P 500 Best Six Months Sell signal and it now ...

Continue Reading →
0

Market Outlook June 2018: Best 8 Months End, Midterm Machinations Suggest Rough Summer for Stocks

To all the market seasonality naysayers and “Sell in May” or Best Six Months/Worst Six Months critics, we say thank you for your skepticism. Despite your disbelief (and perhaps because of it) the recurring seasonal market patterns highlighted in the Stock Trader’s Almanac continue to persist. Of course they are not perfect and do not work 100% of the time, and some have fallen by the wayside and some have shifted – we’ve tracked and updated those.

However, supported by a ...

Continue Reading →
0

Almanac Update June 2018: Worst Month in Midterm Years

June has shone brighter on NASDAQ stocks over the last 47 years as a rule ranking ninth with a 0.6% average gain, up 25 of 47 years. This contributes to NASDAQ’s “Best Eight Months” which ends in June. June ranks near the bottom on the Dow Jones Industrials just above September since 1950 with an average loss of 0.3%. S&P 500 performs poorly as well, ranking tenth, but essentially flat (–0.02% average).

June 2018 ...</p><a class= Continue Reading →

0

Seasonal Research May 2018: Russell 2000 & Small Caps Best Record Week before Memorial Day Weekend

Over the last 21 years, DJIA has advanced just 47.6% of the time during the week before Memorial Day weekend. Of the five major indices we frequently cite, it is the weakest averaging a 0.29% loss. S&P 500, NASDAQ and Russell 1000 are better, but average performance over the last 21 years is still just a fractional gain. Russell 2000 has the best track record, up 71.4% of the time with an average gain of 0.42%. Since 2003, Russell 2000 ...

Continue Reading →
0

May 2018 Market at a Glance

Seasonal:

Bearish. May officially marks the beginning of the “Worst Six Months” for the DJIA and S&P. To wit: “Sell in May and go away.” May has been a tricky month over the years, a well-deserved reputation following the May 6, 2010 “flash crash” and the old “May/June disaster area” from 1965 to 1984. Since 1950, midterm-year Mays rank poorly, #9 ...

Continue Reading →
0

Almanac Update May 2018: Start of “Worst Six Months” for DJIA and S&P 500

May officially marks the beginning of the “Worst Six Months” for the DJIA and S&P. To wit: “Sell in May and go away.” May has been a tricky month over the years, a well-deserved reputation following the May 6, 2010 “flash crash”. It used to be part of the “May/June disaster area.” From 1965 to 1984 the S&P 500 was down during May fifteen out of twenty times. Then from 1985 through 1997 May was the best month, gaining ground ...

Continue Reading →
0
Page 15 of 16 «...101213141516