

As we enter the last month of the Best Six Months, the market logged its first down quarter in two years since the beginning of the pandemic. Going back to 1930 when our S&P 500 data begins Q1 was positive 55 years and negative 37 times over the 92-year span. Overall, years that advanced in Q1 were up 46 of the 55 years or 83.6% of the time with an average gain of 13.2% for S&P 500. Years when Q1 was down, were positive only 16 of the 37 years or 43.2% of the time for an average loss of -0.1%.
What jumped out at us were the midterm years that had losing first quarters. In the table we compiled here, the events during these years have an eerie resonance to what’s happening today in 2022. War, conflict, inflation, recession, and rate hikes were common themes in these midterm years. Only three of these 10 midterm years had sizable gains: 1938 (War in Europe), 1942 (WWII) and 1982 (Secular Bull). Losses carried over into Q2 in all but 3 years: 1938, 1942 and 2018. Third quarters rebounded in all but three years: 1966 (Vietnam), 1974 (Oil Embargo/Watergate) and 2002 (Iraq). The only real Q4 blemish was 2018 when the Fed hiked rates too briskly.
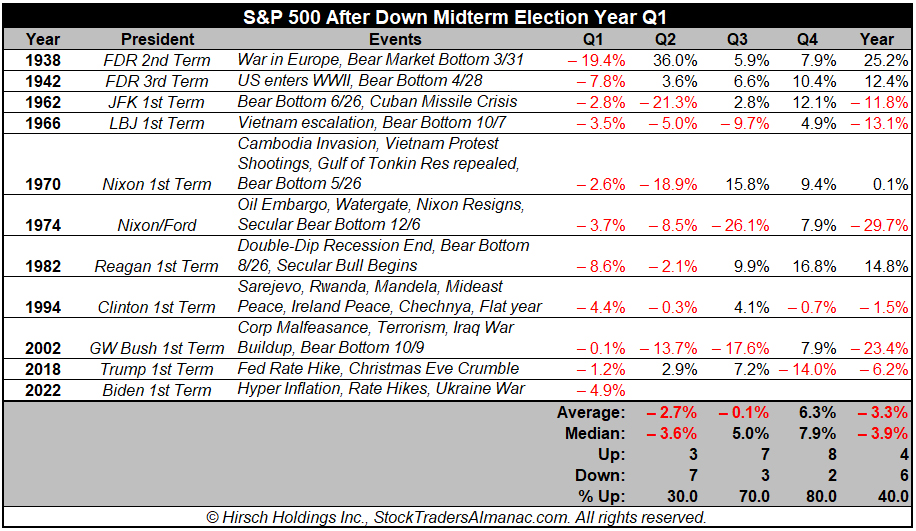
In general, after a down midterm Q1, losses tended to carry over into Q2 and the market began to find its footing in Q3 and rally into Q4. Protracted crises in 1962, 1966, 1970, 1974, and 2002 delivered the most negative results though all had significant bear market bottoms. At the Q1 crossroads in 2022 we are faced with similar conditions. Persistent hyperinflation (Jeff’s Dunkin large iced black coffee is up 29% in the last month from $3.02 to $3.89), a rising rate environment that’s stoking inverted yield curve/recession fears, the brutal war in Ukraine and the new Cold War 2.0 with Russia are threatening a bear market on the backdrop of the heightened volatility we have been warning of since our Annual Forecast in December.
War Low Support Holding
Technically we are encouraged by the fact that the intraday low on February 24, the day Russia invaded Ukraine, has held, and survived at least one solid test on March 14. We have been using the NASDAQ 100 Index (NDX), which is tracked by the Invesco QQQ Trust (QQQ), as our benchmark of late as it has been leading the market in both directions for several years. As we have illustrated in the chart here the lows on February 24 and March 14 with the late-February/early-March rally in between has created a potential W-123 swing bottom. The 14300 level around point 2 becomes support, which is also right at the 50-day moving average. NDX has bumped into resistance around 15000 and the 200-day moving average.
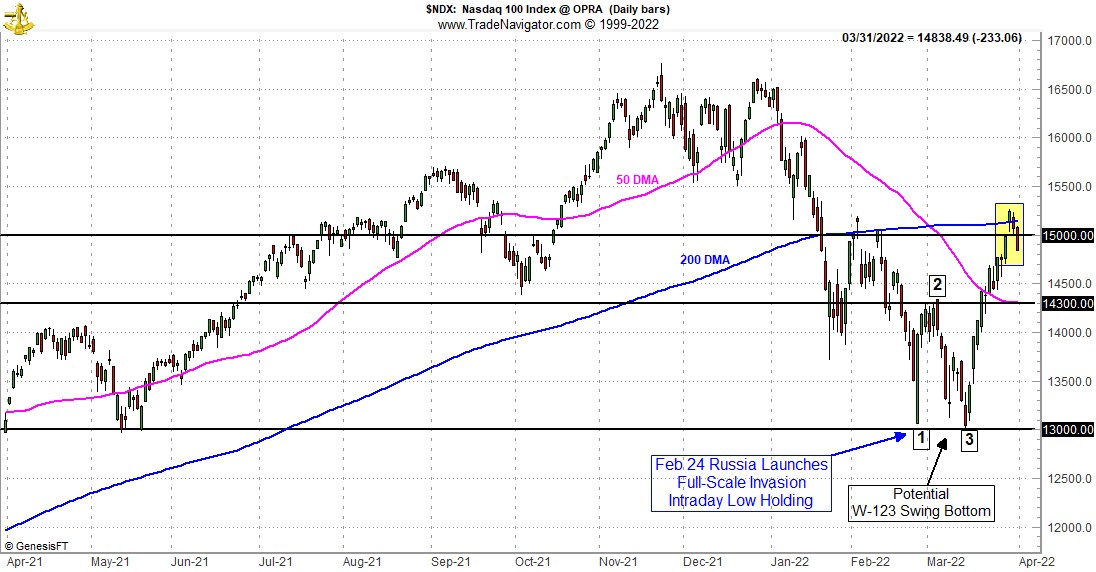
It was also encouraging that the market had rallied back up to and through the 200-day moving average. We believe reclaiming the 200 DMA again would be most constructive. Market internals are also improving with advancers recently outpacing decliners and new highs beating new lows. We believe continued improvement technically and internally is needed for the rally to have staying power. Barring any major escalation in Ukraine, we suspect the market to log additional gains in April as the Best Six Months come to a close and then move sideways during much of Q2 and Q3. Likely testing the lows before rallying in Q4 and into 2023.
Recession Not Forgone Conclusion.
Financial pundits, market analysts and economists have been debating when and if the economy will go into recession and what that means for the stock market. We’ve all heard the stats that bear markets lead recessions by 8 months or so. But the dire warnings that the slightly inverted yield curve or the negative yield spread that has recently occurred will definitely lead to recession may be an exaggeration and a fear tactic to get attention. Yes, a solidly inverted yield curve or negative spread has been an indication of recession. But this slight inversion can also remedy itself before becoming recessionary. In addition, these inversions of the past everyone is citing came from much higher interest rate levels and none have occurred from anywhere near the historically low rates we have now. It’s a big difference going from 4.75 to 5.50 as we did in 1999 than going from Zero to 1.0.
Many have pointed out that the lead time from these negative spreads or inversions to recessions has been years in many instances. We believe there may also be something odd with the negative yield spreads this time around. Unlike any previous period, while the spread between the 10-year and the 2-year is going down toward zero the 10-year/Fed Funds spread is rising.
Perhaps a recession is not such a foregone conclusion or at least it may only happen years down the road. We believe we will suffer another recession, someday. But it is hard to fathom a recession in the near future with the unemployment rate and claims so low and states flush with cash, infrastructure spending and the massive proposed federal budget currently on the table. It is our opinion that the news flow on the war, the Fed, oil prices and inflation will continue to drive the daily volatility.
APR
2022