
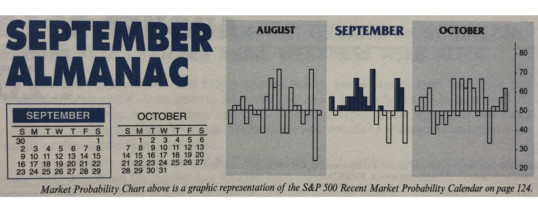
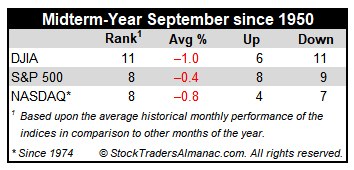
Since 1950, September is the worst performing month of the year for DJIA, S&P 500 and NASDAQ (since 1971). September was creamed four years straight from 1999-2002 after four solid years from 1995-1998 during the dot.com bubble madness. Although September’s overall rank improves modestly in midterm years going back to 1950, average losses widen for DJIA (–1.0%) and NASDAQ (–0.8%). S&P 500’s average September loss improves slightly from –0.5% to –0.4% in midterm years. Although September 2002 does influence the average declines, the fact remains DJIA has declined in 11 of the last 17 midterm-year Septembers.
The month has opened strong in 14 of the last 23 years (a fading trend as S&P 500 has been down five of the last seven first trading days), but as tans begin to fade and the new school year commences, fund managers tend to clean house as the end of the third quarter approaches, causing some nasty selloffs near month-end over the years. Recent substantial declines occurred following the terrorist attacks in 2001 (DJIA: –11.1%), 2002 (DJIA –12.4%), the collapse of Lehman Brothers in 2008 (DJIA: –6.0%) and U.S. debt ceiling debacle in 2011 (DJIA –6.0%).
In recent years, Labor Day has become the unofficial end of summer and the three-day weekend has become prime vacation time for many. Business activity ahead of the holiday was more energetic in the old days. From 1950 through 1977 the three days before Labor Day pushed the DJIA higher in twenty-five of twenty-eight years. Bullishness has since shifted to favor the two days after the holiday as opposed to the days before. DJIA has gained in 16 of the last 24 Tuesdays and 17 of the last 23 Wednesdays following Labor Day.
AUG
2018