
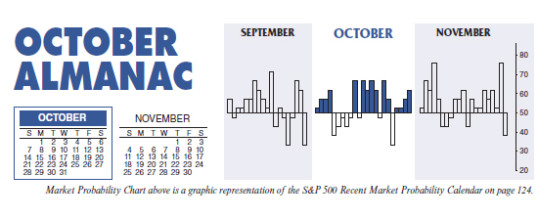
October often evokes fear on Wall Street as memories are stirred of crashes in 1929, 1987, the 554-point drop on October 27, 1997, back-to-back massacres in 1978 and 1979, Friday the 13th in 1989 and the 733-point drop on October 15, 2008. During the week ending October 10, 2008, Dow lost 1,874.19 points (18.2%), the worst weekly decline in our database going back to 1901, in point and percentage terms. The term “Octoberphobia” has been used to describe the phenomenon of major market drops occurring during the month. Market calamities can become a self-fulfilling prophecy, so stay on the lookout and don’t get whipsawed if it happens.
But October has become a turnaround month—a “bear killer” if you will. Twelve post-WWII bear markets have ended in October: 1946, 1957, 1960, 1962, 1966, 1974, 1987, 1990, 1998, 2001, 2002 and 2011 (S&P 500 declined 19.4%). However, eight were midterm bottoms. This year is a midterm year, but the market has been resilient thus far during the Worst Months which may temper full-month October results.
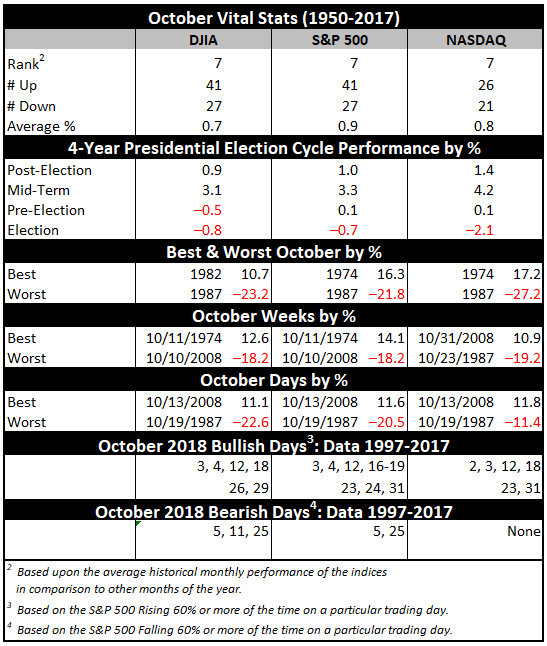
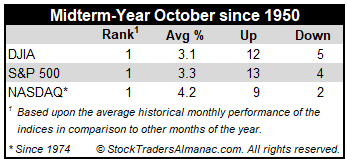
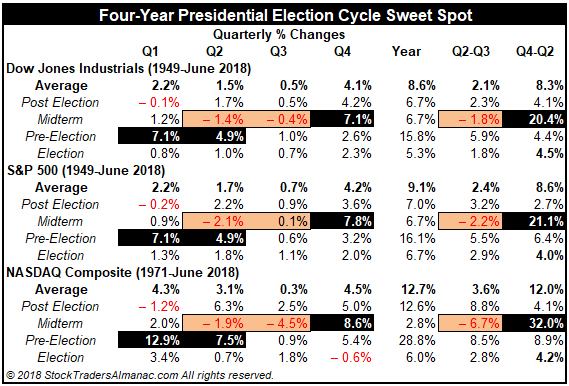
Midterm election year Octobers are downright stellar thanks to the major turnarounds mentioned above; ranking number one on the Dow, S&P 500 and NASDAQ. This is also the beginning of the sweet spot of the four-year-presidential-election-cycle. The fourth quarter of the midterm years combines with the first and second quarters of the pre-election years for the best three consecutive quarter span for the market, averaging 20.4% for the Dow and 21.1% for the S&P 500 (since 1949), and an amazing 32.0% for NASDAQ (since 1971).
OCT
2018