
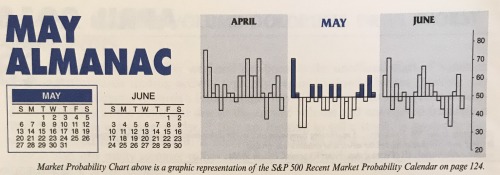
May officially marks the beginning of the “Worst Six Months” for the DJIA and S&P. To wit: “Sell in May and go away.” May has been a tricky month over the years, a well-deserved reputation following the May 6, 2010 “flash crash”. It used to be part of the “May/June disaster area.” From 1965 to 1984 the S&P 500 was down during May fifteen out of twenty times. Then from 1985 through 1997 May was the best month, gaining ground every single year (13 straight gains) on the S&P, up 3.3% on average with the DJIA falling once and two NASDAQ losses.
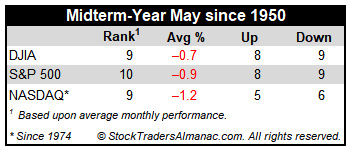
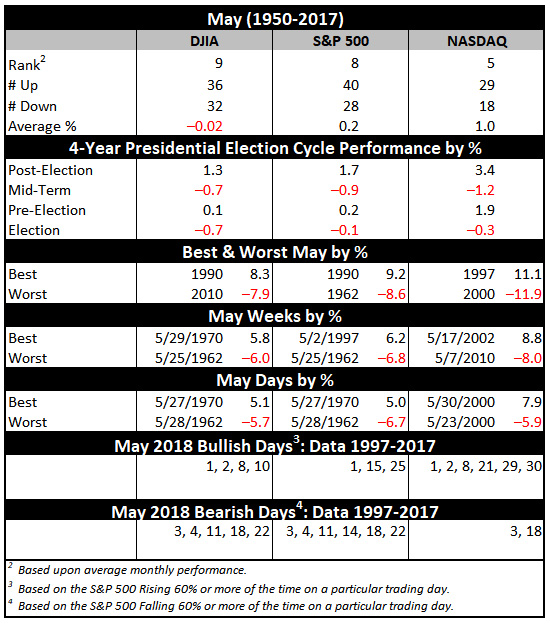
In the years since 1997, May’s performance has been erratic; DJIA up ten times in the past twenty years (three of the years had gains in excess of 4%). NASDAQ suffered five May losses in a row from 1998-2001, down – 11.9% in 2000, followed by eleven sizable gains in excess of 2.5% and four losses, the worst of which was 8.3% in 2010. Since 1950, midterm-year Mays rank poorly, #9 DJIA with an average loss of -0.7% and #10 S&P 500 with an average loss of -0.9%.
MAY
2018