
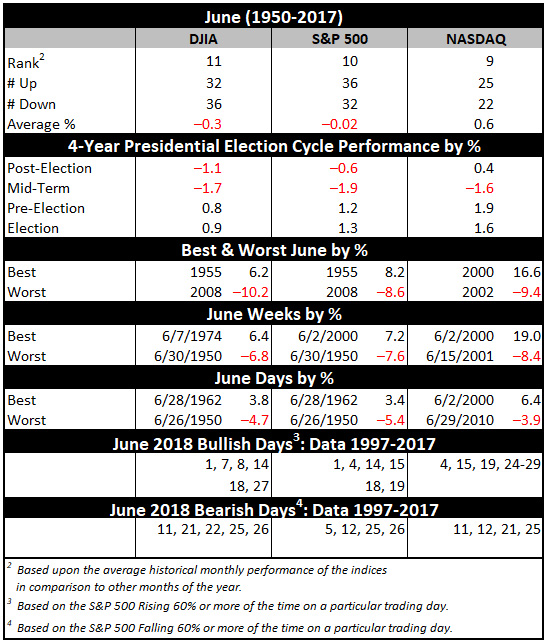
June has shone brighter on NASDAQ stocks over the last 47 years as a rule ranking ninth with a 0.6% average gain, up 25 of 47 years. This contributes to NASDAQ’s “Best Eight Months” which ends in June. June ranks near the bottom on the Dow Jones Industrials just above September since 1950 with an average loss of 0.3%. S&P 500 performs poorly as well, ranking tenth, but essentially flat (–0.02% average).
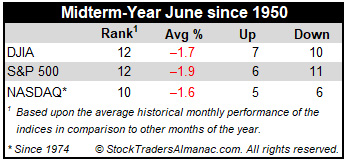
In midterm years since 1950, June is ranked #12, or dead last, for DJIA and S&P 500. June has been the 10th worst month for NASDAQ in midterm years, since 1971. Average losses range from 1.6% on NASDAQ to 1.9% on the S&P 500. Of the three indexes, none has a winning track record in midterm year Junes. All have declined more than they have risen.
JUN
2018