
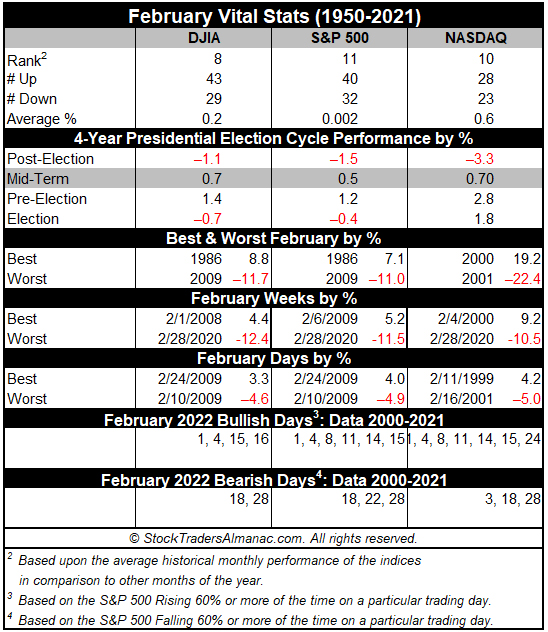
Even though February is right in the middle of the Best Six Months, its long-term track record, since 1950, is rather tepid. February ranks no better than sixth and has posted meager average gains except for the Russell 2000. Small cap stocks, benefiting from “January Effect” carry over; historically tend to outpace large cap stocks in February. The Russell 2000 index of small cap stocks turns in an average gain of 1.1% in February since 1979—just the sixth best month for that benchmark. With Russell 2000 lagging this January, prospects for February outperformance appear slim.
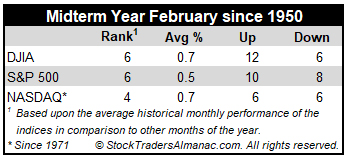
In midterm years, February’s performance generally improves with average returns all increasing. Here again it is the Russell 2000 small-cap index that shines brightest gaining 1.4% on average since 1982. DJIA and NASDAQ average gains of 0.7% (since 1950 & 1974) while S&P 500 lags with average advance of 0.5% (since 1974).
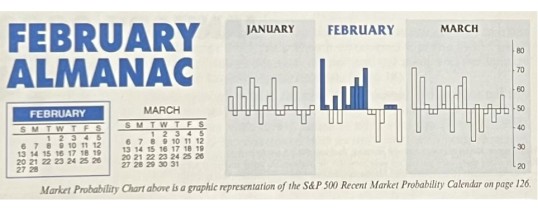
The first trading day is bullish for DJIA, S&P 500 and NASDAQ. Average gains on the first day over the last 21-year period are right around 0.4%. Strength then tends to fade after that until the stronger fourth, sixth, ninth, ten and eleventh trading days.
Presidents’ Day is the lone holiday that exhibits weakness the day before and after (Stock Trader’s Almanac 2022, page 100). The Friday before this mid-winter three-day break can be treacherous and average declines persist for three trading days after the holiday going back to 1980. In recent years, trading before and after the holiday has been more bullish. S&P 500 has been up 10 of the last 11 years on the day before and NASDAQ has been up 7 of the last 9 years on the day after.
FEB
2022