
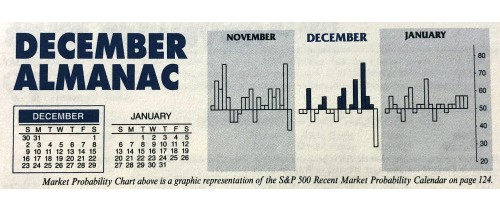
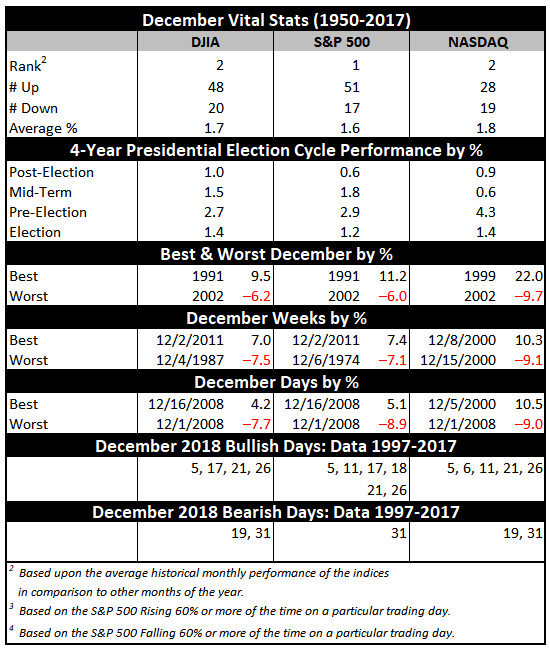
December is the number one S&P 500 month and the second-best month on the Dow Jones Industrials since 1950, averaging gains of 1.6% and 1.7% respectively. It’s also the second best for NASDAQ (1971). Rarely does the market fall precipitously in December. When it does it is usually a turning point in the market—near a top or bottom. If the market has experienced fantastic gains leading up to December, stocks can pullback.
Trading in December is holiday inspired and fueled by a buying bias throughout the month. However, the first part of the month tends to be weaker as tax-loss selling and yearend portfolio restructuring begins. Regardless, December is laden with market seasonality and important events.
Small caps tend to start to outperform larger caps near the middle of the month (early January Effect). The “Santa Claus Rally” begins on the open on Christmas Eve day and lasts until the second trading day of 2019. Average S&P 500 gains over this seven trading-day range since 1969 are a respectable 1.3%.
This is the first indicator for the market in the New Year. Years when the Santa Claus Rally (SCR) has failed to materialize are often flat or down. The last six times SCR (the last five trading days of the year and the first two trading days of the New Year) has not occurred were followed by three flat years (1994, 2005 and 2015) and two nasty bear markets (2000 and 2008) and a mild bear that ended in February 2016. As Yale Hirsch’s now famous line states, “If Santa Claus should fail to call, bears may come to Broad and Wall.”
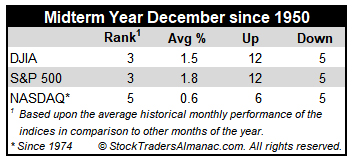
In the last seventeen midterm years, December’s rankings slip modestly to #3 S&P 500 (1.8%) and DJIA (1.5%) and #5 NASDAQ (0.6% since 1974).
Trading the day before and the day after Christmas is generally bullish across the board with the greatest gains coming from the day before (DJIA up eight of the last eleven). On the last trading day of the year, NASDAQ has been down in fifteen of the last eighteen years after having been up twenty-nine years in a row from 1971 to 1999. DJIA and S&P 500 have also been struggling recently and exhibit a bearish bias over the last twenty-one years.
DEC
2018