
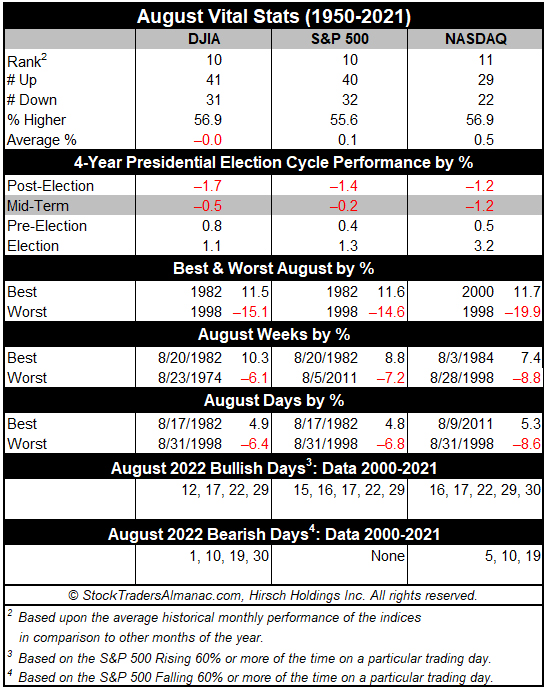
Money flows from harvesting made August a great stock market month in the first half of the Twentieth Century. It was the best DJIA month from 1901 to 1951. Now August is amongst the worst months of the year. It is the worst DJIA, S&P 500 and Russell 2000 month over the last 34 years, 1988-2021 with average declines ranging from –0.3% by Russell 2000 to –0.8% by DJIA. For NASDAQ August ranks second worst over the same period with an average gain of 0.3%.
Contributing to this poor performance since 1988; the second shortest bear market in history (45 days) caused by turmoil in Russia, the Asian currency crisis and the Long-Term Capital Management hedge fund debacle ending August 31, 1998, with the DJIA shedding 6.4% that day. DJIA dropped 1344.22 points for the month, off 15.1%—which is the second worst monthly percentage DJIA loss since 1950. Saddam Hussein triggered a 10.0% slide in August 1990. The best DJIA gains occurred in 1982 (11.5%) and 1984 (9.8%) as bear markets ended. Sizeable losses in 2010, 2011, 2013 and 2015 of over 4% on DJIA have widened Augusts’ average decline.
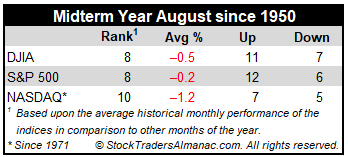
In midterm years since 1950, Augusts’ rankings improve slightly: #8 DJIA and S&P 500, #10 NASDAQ (since 1974) and #10 Russell 2000 (since 1982). Average losses range from –0.2% for S&P 500 to –1.3% for Russell 2000. All four indexes have winning track records, but losses have frequently been substantially larger than gains. DJIA and NASDAQ suffered double-digit losses in 1974, 1990 and 1998.
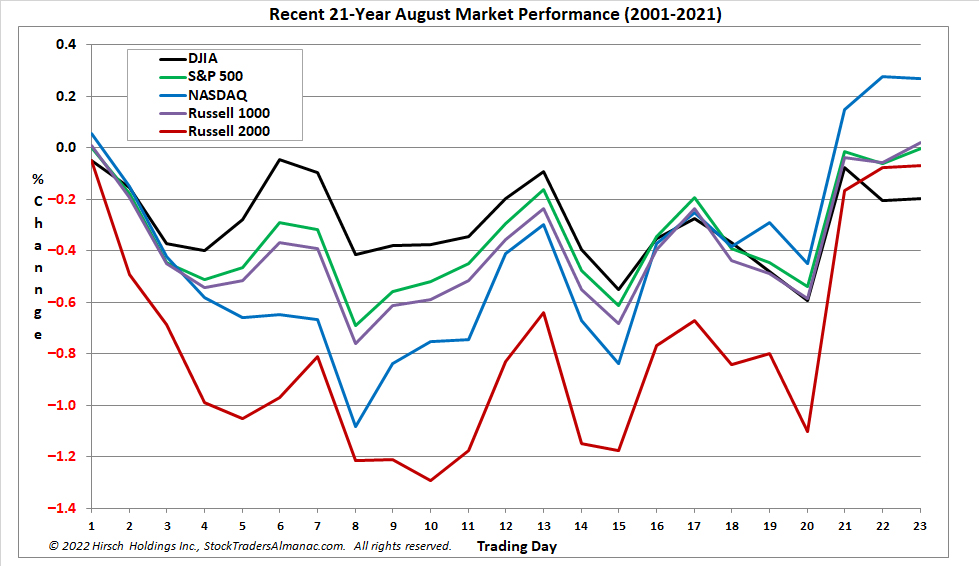
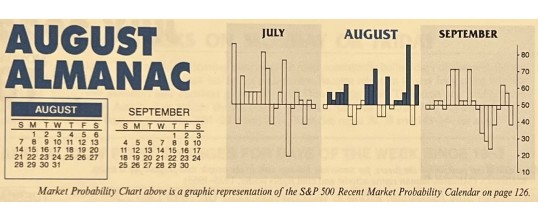
Historically, the first eight or nine trading days of the month have exhibited weakness while mid-month is better. This strength is visible above on trading days 11, 12 and 13. The end of August tends to be softer when traders evacuate Wall Street for a summer finale. The last five days were bearish from 1996 to 2013 but have been positive in seven of the last eight years. However, S&P 500 has been up only nine times on the penultimate day in the past 26 years.
On Monday of monthly options expiration DJIA has been up 17 of the last 27 years with three up more than 1%. Monthly expiration Friday has been mixed recently. DJIA has been up the last four years straight after declining in seven of the previous eight. Expiration week is down 19 times in 32 years since 1990, with some sizable losses; –2.6% in 1990, –2.3% in 1992, –4.2% in 1997, –4.0% in 2011, –2.2% in 2013 and –5.8% in 2015. The week after expiration is stronger up 20 of the last 32.
AUG
2022