
The first trading day of April and the second quarter, has enjoyed exceptional strength over the past 23 years, advancing 17 times with an average gain of 0.49% in all 23 years for S&P 500. Declines occurred in 2001, 2002, 2005, 2013, 2015 and 2017. The worst, or largest decline, was 1.25% in 2001. This year, April 2 is also the day after Easter which has been the S&P 500’s worst post-holiday trading session. From 1984 to 2003, S&P 500 declined 16 times. In the fourteen years since, S&P has been up ten times.
April marks the end of the historically “Best Six Months” for DJIA and the S&P 500, November-April. The historically “Worst Months,” May-October have been more pronounced in past midterm years.
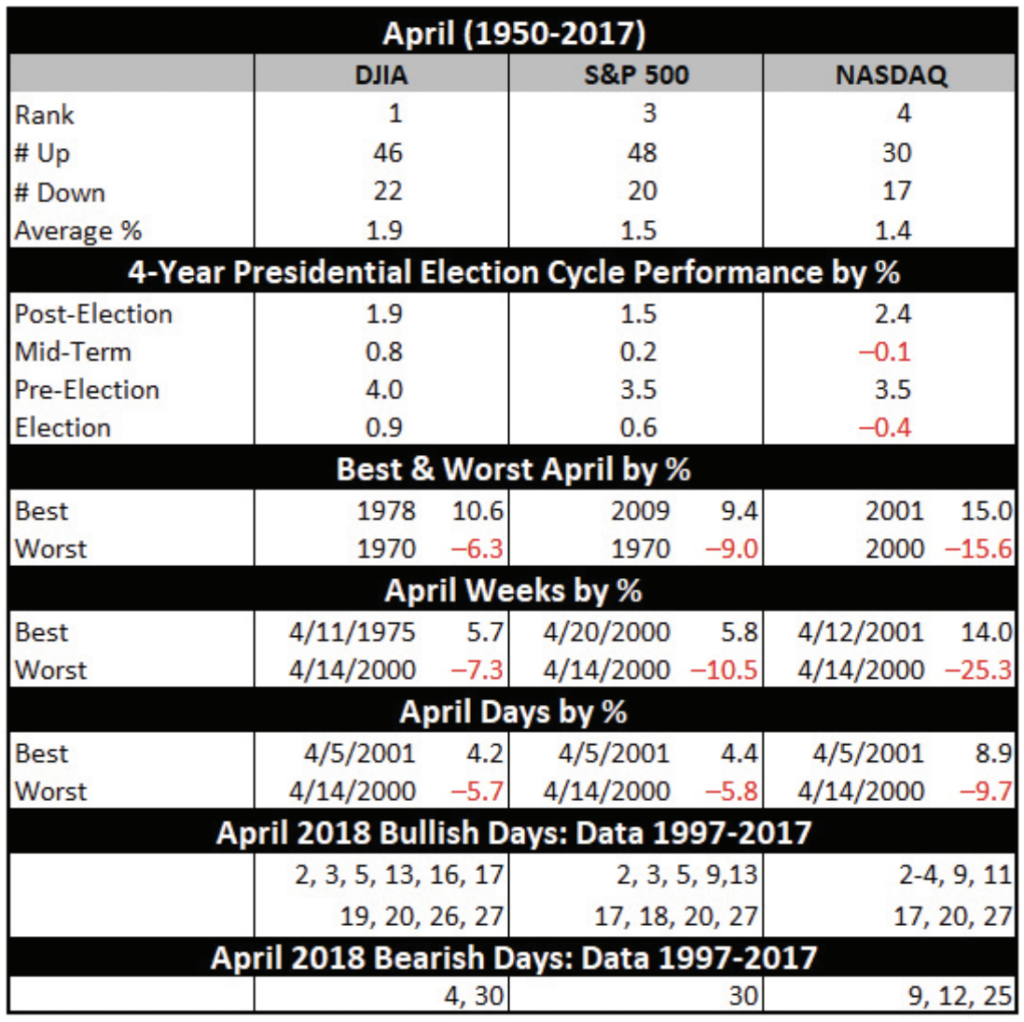
April 1999 was the first month to gain 1000 DJIA points. However, from 2000 to 2005, “Tax” month was hit, declining in four of six years. Since 2006, April has been up twelve years in a row with an average gain of 2.5% to reclaim its position as the best DJIA month since 1950. April is third best for S&P (since 1950) and fourth best for NASDAQ (since 1971).
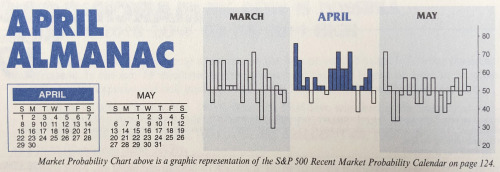
The first half of April used to outperform the second half but since 1994 that has no longer been the case. The effect of April 15 Tax Deadline appears to be diminished. Traders and investors are apparently more focused on first quarter earnings during April. Exceptional Q1 earnings and positive surprises tend to be anticipated with stocks and the market moving up in advance of the announcements and consolidating or correcting afterwards.
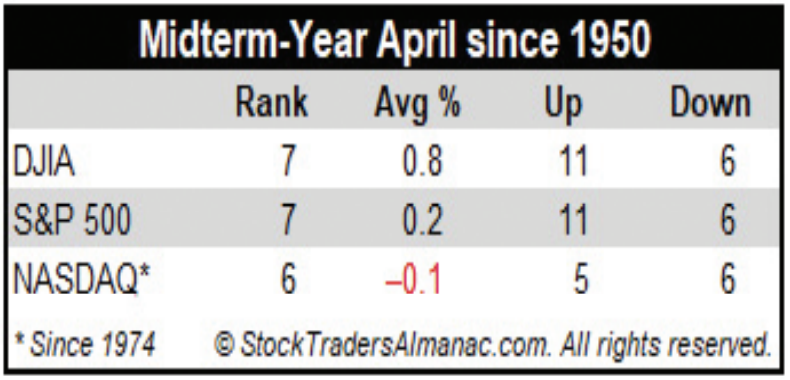
Typical midterm-election year woes in the past have tempered April’s performance since 1950. April is DJIA’s and S&P 500’s seventh best month in midterm-election years, up 11 of the last 17. For NASDAQ, April is the sixth best month in midterm years.
APR
2018