

We’ve been digging and searching for indications that this market is running out of steam and we are headed for some sort of major correction, sizeable pullback or a bear market next year, but we have been hard-pressed to find any such data. Sure valuations and sentiment are rather high, but we all know that situation can go on for longer than most bearish investors can stay short or on the sidelines. A growing economy with increasing corporate earnings can bring price/earnings valuations down as well as a price decline.
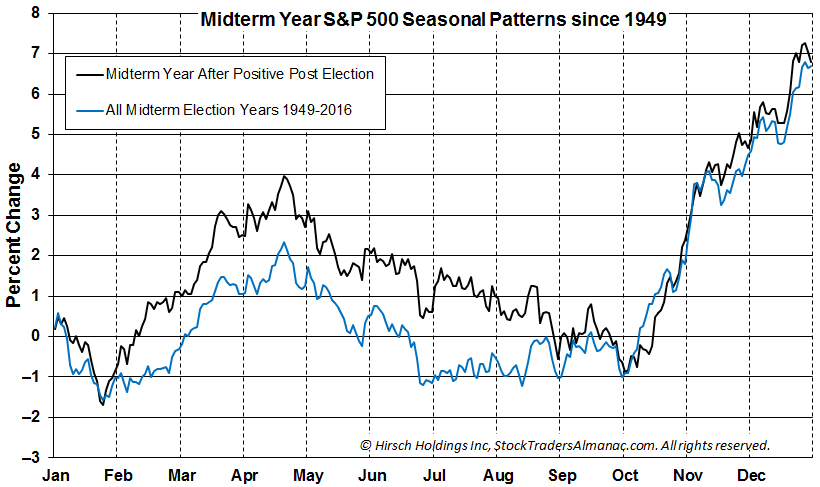
We do expect a mild soft patch next year during the Worst Six Months (May-October) as is often the case. You might think that such a banner market rally in the usually weak post-election year would “steal” gains from the midterm gains. But that has not really been the case historically. As you can see in the chart below the black line representing midterm years that followed positive post-election years runs extremely close to the blue line of all midterm years. There are other factors at play that have led us to believe next year is likely to be another strong one.
Secular Bull Underway
For one thing it is becoming apparent that my 2010 Super Boom Forecast for the Dow Jones Industrial Average (DJIA) to reach 38,820 by the year 2025 is on track. I first released that forecast in my Almanac Newsletter in May 2010 (starts on page 10 of the June 2010 newsletter) with DJIA around 10,000. I last updated this forecast in March of 2017. I now believe that the February 2016 bear market low was the end of the last secular bear and the beginning of the new secular bull market.
If you refer to the Bull and Bear Market stats in your handy Stock Trader’s Almanac 2018 on pages 131-132 you will see that the average bull market gain for DJIA is 85.6%, for the S&P 500 it’s 81.5% and for the NASDAQ Composite it is 129.7%. That equates to about DJIA 29,000, S&P 500 3,300 and NASDAQ 9,800. From the close of the market on December 29, 2017 that’s a 17.3% move for DJIA, 23.4% for S&P and 42.0% for NASDAQ.
Now, you might be concerned that it’s been a long time since we have had a 10% correction and we are way overdue. It is getting close to two years since the last 10% drop (the aforementioned February 2016 bear market low). We are not saying that we will not have a 10% next year; we may very well have one in the worst six months of 2018, but just because we are over the average timespan between 10% corrections in bull markets does not mean we are overdue for one. The gap from 2011 to 2015 was 1326 days for example. See the rest in our study from August.
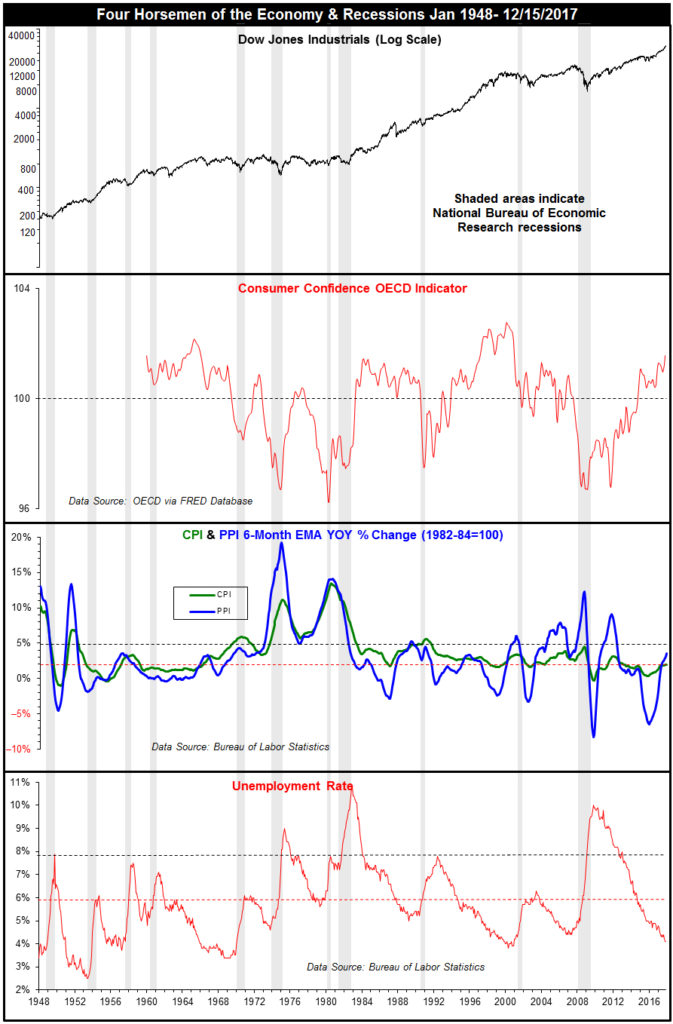
Four Horseman of the Economy
The big horseman of the economy is the Dow. While it may be an antiquated metric to some, it is the oldest continuously tracked market barometer in the book. And it arguably contains 30 of the most influential stocks in the world. Aside from a few blips and minor bears it has been going strong since March 2009. Gains tend to beget gains.
Consumer confidence has been on the rise for the past six years and continues to trend higher, suggesting consumers and regular folks are not doing too badly. The unemployment rate continues to fall and sits at 4.1%. And the labor participation rate has begun to rise as workers are coming back into the labor force. When people rejoin the workforce and unemployment stays low, it suggests a resilient economy on the verge of accelerating.
Inflation as measured by my 6-month exponential moving average calculation on the CPI and PPI is also looking positive just about hitting that sweet spot of 2-5%. CPI is just a hair shy at 1.98%. A little more growth could lead to some wage growth and a healthy rise inflation, allowing the Fed to continue to normalize rates.
2018 Forecast
Based on everything I have analyzed, including the risks of high market valuations, rocky geopolitics, a new Federal Reserve Chair and the history of midterm-election-year volatility I have laid out three scenarios for next year:
• Worst Case – 5% chance. Full blown midterm bear market caused by North Korea actually setting off a nuke, no positive impact from tax reform, or some other doomsday scenario.
• Base Case – 47.5% chance. Above average midterm year gains in the range of 8-15%, a mild worst six correction or pullback.
• Best Case – 47.5% chance. Everything pans out, tax reform juices corporate earnings, bonuses & paychecks grow, economy grows. DJIA 29,000, S&P 3,300, NASDAQ 9,800
The midterm election outcome may matter less than many people think with this president. Even if the Democrats take back both houses of Congress President Trump is highly likely to veto any Democratic legislation that comes to his desk. The Dems are not likely to get a two-thirds veto override majority. The current Congress and President Trump have put the country on a new path with less regulation and lower taxes. This direction will remain in place until at least January 2021; the next regularly scheduled Inauguration Day.
Then there is my January Indicator Trifecta which served us quite well this year. While post-election years are notoriously bearish, when all three January Indicators – the Santa Claus Rally, First Five Days and the full-month January Barometer – are all positive we hit the trifecta. Post-election years since 1949 average about 6.2%. When the January Indicator Trifecta is positive post-election years average 24.0%.
It is a similar case for the midterm year. Average gain since 1950 is 6.7%, but with a positive January Indicator Trifecta midterm years average 21.1% – all based on the S&P 500. So the forecast is out, but as always I reserve the right to make adjustments on the close of January 2018.
JAN
2018